Logstash
The Energy Logserver use Logstash service to dynamically unify data from disparate sources and normalize the data into destination of your choose. A Logstash pipeline has two required elements, input and output, and one optional element filter. The input plugins consume data from a source, the filter plugins modify the data as you specify, and the output plugins write the data to a destination. The default location of the Logstash plugin files is: /etc/logstash/conf.d/. This location contain following Energy Logserver
Energy Logserver default plugins:
01-input-beats.conf01-input-syslog.conf01-input-snmp.conf01-input-http.conf01-input-file.conf01-input-database.conf020-filter-beats-syslog.conf020-filter-network.conf099-filter-geoip.conf100-output-elasticsearch.confnaemon_beat.exampleperflogs.example
Logstash - Input “beats”
This plugin wait for receiving data from remote beats services. It use tcp /5044 port for communication:
            input {
                    beats {
                            port => 5044
                    }
            }
Logstash - Input “network”
This plugin read events over a TCP or UDP socket assigns the appropriate tags:
	input {
	        tcp {
	                port => 5514
	                type => "network"

	                tags => [ "LAN", "TCP" ]
	        }

	        udp {
	                port => 5514
	                type => "network"

	                tags => [ "LAN", "UDP" ]
	        }
	}
To redirect the default syslog port (514/TCP/UDP) to the dedicated collector port, follow these steps:
firewall-cmd --add-forward-port=port=514:proto=udp:toport=5514:toaddr=127.0.0.1 --permanent
firewall-cmd --add-forward-port=port=514:proto=tcp:toport=5514:toaddr=127.0.0.1 --permanent
firewall-cmd --reload
systemctl restart firewalld
Logstash - Input SNMP
The SNMP input polls network devices using Simple Network Management Protocol (SNMP) to gather information related to the current state of the devices operation:
	input {
	  snmp {
	    get => ["1.3.6.1.2.1.1.1.0"]
	    hosts => [{host => "udp:127.0.0.1/161" community => "public" version => "2c"  retries => 2  timeout => 1000}]
	  }
	}
Logstash - Input HTTP / HTTPS
Using this input you can receive single or multiline events over http(s). Applications can send an HTTP request to the endpoint started by this input and Logstash will convert it into an event for subsequent processing. Sample definition:
	input {
	 http {
	    host => "0.0.0.0"
	    port => "8080"
	  }
	}
Events are by default sent in plain text. You can enable encryption by setting ssl to true and configuring the ssl_certificate and ssl_key options:
	input {
	 http {
	    host => "0.0.0.0"
	    port => "8080"
	    ssl => "true"
	    ssl_certificate => "path_to_certificate_file"
	    ssl_key => "path_to_key_file"
	  }
	}
Logstash - Input File
This plugin stream events from files, normally by tailing them in a manner similar to tail -0F but optionally reading them from the beginning. Sample definition:
	file {
	    path => "/tmp/access_log"
	    start_position => "beginning"
	  }
Logstash - Input database
This plugin can read data in any database with a JDBC interface into Logstash. You can periodically schedule ingestion using a cron syntax (see schedule setting) or run the query one time to load data into Logstash. Each row in the resultset becomes a single event. Columns in the resultset are converted into fields in the event.
Logasth input - MySQL
Download jdbc driver: https://dev.mysql.com/downloads/connector/j/
Sample definition:
input {
  jdbc {
    jdbc_driver_library => "mysql-connector-java-5.1.36-bin.jar"
    jdbc_driver_class => "com.mysql.jdbc.Driver"
    jdbc_connection_string => "jdbc:mysql://localhost:3306/mydb"
    jdbc_user => "mysql"
    jdbc_password => "mysql"
    parameters => { "favorite_artist" => "Beethoven" }
    schedule => "* * * * *"
    statement => "SELECT * from songs where artist = :favorite_artist"
  }
}
Logasth input - MSSQL
Download jdbc driver: https://docs.microsoft.com/en-us/sql/connect/jdbc/download-microsoft-jdbc-driver-for-sql-server?view=sql-server-ver15
Sample definition:
input {
  jdbc {
    jdbc_driver_library => "./mssql-jdbc-6.2.2.jre8.jar"
    jdbc_driver_class => "com.microsoft.sqlserver.jdbc.SQLServerDriver"
    jdbc_connection_string => "jdbc:sqlserver://VB201001000;databaseName=Database;"
    jdbc_user => "mssql"
    jdbc_password => "mssql"
    jdbc_default_timezone => "UTC"
    statement_filepath => "/usr/share/logstash/plugin/query"
    schedule => "*/5 * * * *"
    sql_log_level => "warn"
    record_last_run => "false"
    clean_run => "true"
  }
}
Logstash input - Oracle
Download jdbc driver: https://www.oracle.com/database/technologies/appdev/jdbc-downloads.html
Sample definition:
input {
  jdbc {
    jdbc_driver_library => "./ojdbc8.jar"
    jdbc_driver_class => "oracle.jdbc.driver.OracleDriver"
    jdbc_connection_string => "jdbc:oracle:thin:@hostname:PORT/SERVICE"
    jdbc_user => "oracle"
    jdbc_password => "oracle"
    parameters => { "favorite_artist" => "Beethoven" }
    schedule => "* * * * *"
    statement => "SELECT * from songs where artist = :favorite_artist"
  }
}
Logstash input - PostgreSQL
Download jdbc driver: https://jdbc.postgresql.org/download.html
Sample definition:
input {
    jdbc {
        jdbc_driver_library => "D:/postgresql-42.2.5.jar"
        jdbc_driver_class => "org.postgresql.Driver"
        jdbc_connection_string => "jdbc:postgresql://127.0.0.1:57610/mydb"
        jdbc_user => "myuser"
        jdbc_password => "mypw"
        statement => "select * from mytable"
    }
}
Logstash - Input CEF
The common event format (CEF) is a standard for the interoperability of event or log generating devices and applications. The standard defines a syntax for log records. It comprises of a standard prefix and a variable extension that is formatted as key-value pairs.
input {
  tcp {
    codec => cef { delimiter => "\r\n" }
    port => 12345
  }
}
This setting allows the following character sequences to have special meaning:
\r(backslash “r”) - means carriage return (ASCII 0x0D)\n(backslash “n”) - means newline (ASCII 0x0A)
Logstash - Input OPSEC
FW1-LogGrabber is a Linux command-line tool to grab logfiles from remote Checkpoint devices. It makes extensive use of OPSEC Log Export APIs (LEA) from Checkpoint’s OPSEC SDK 6.0 for Linux 50.
Build FW1-LogGrabber
FW1-LogGrabber v2.0 and above can be built on Linux x86/amd64 platforms only.
If you are interested in other platforms please check FW1-LogGrabber v1.11.1 website
Download dependencies
FW1-LogGrabber uses API-functions from Checkpoint’s OPSEC SDK 6.0 for Linux 50.
You must take care of downloading the Checkpoint OPSEC SDK and extracting it inside the OPSEC_SDK folder.
You also need to install some required 32-bit libraries.
If you are using Debian or Ubuntu, please run:
sudo apt-get install gcc-multilib g++-multilib libelf-dev:i386 libpam0g:i386 zlib1g-dev:i386
If you are using CentOS or RHEL, please run:
sudo yum install gcc gcc-c++ make glibc-devel.i686 elfutils-libelf-devel.i686 zlib-devel.i686 libstdc++-devel.i686 pam-devel.i686
Compile source code
Building should be as simple as running GNU Make in the project root folder:
make
If the build process complains, you might need to tweak some variables inside the Makefile (e.g. CC, LD and OPSEC_PKG_DIR) according to your environment.
Install FW1-LogGrabber
To install FW1-LogGrabber into its default location /usr/local/fw1-loggrabber (defined by INSTALL_DIR variable), please run
sudo make install
Set environment variables
FW1-LogGraber makes use of two environment variables, which should be defined in the shell configuration files.
LOGGRABBER_CONFIG_PATHdefines a directory containing configuration files (fw1-loggrabber.conf,lea.conf). If the variable is not defined, the program expects to find these files in the current directory.LOGGRABBER_TEMP_PATHdefines a directory where FW1-LogGrabber will store temporary files. If the variable is not defined, the program stores these files in the current directory.
Since the binary is dynamically linked to Checkpoint OPSEC libraries, please also add /usr/local/fw1-loggrabber/lib to LD_LIBRARY_PATH or to your dynamic linker configuration with
sudo echo /usr/local/fw1-loggrabber/lib > /etc/ld.so.conf.d/fw1-loggrabber.conf
sudo ldconfig
Configuration files
lea.conf file
Starting with version 1.11, FW1-LogGrabber uses the default connection configuration procedure for OPSEC applications. This includes server, port and authentication settings. From now on, all this parameters can only be configured using the configuration file lea.conf (see --leaconfigfile option to use a different LEA configuration file) and not using the command-line as before.
lea_server ip <IP address>specifies the IP address of the FW1 management station, to which FW1-LogGrabber should connect to.lea_server port <port number>is the port on the FW1 management station to which FW1-LogGrabber should connect to (for unauthenticated connections only).lea_server auth_port <port number>is the port to be used for authenticated connection to your FW1 management station.lea_server auth_type <authentication mechanism>you can use this parameter to specify the authentication mechanism to be used (default issslca); valid values aresslca,sslca_clear,sslca_comp,sslca_rc4,sslca_rc4_comp,asym_sslca,asym_sslca_comp,asym_sslca_rc4,asym_sslca_rc4_comp,ssl,ssl_opsec,ssl_clear,ssl_clear_opsec,fwn1andauth_opsec.opsec_sslca_file <p12-file>specify the location of the PKCS#12 certificate, when using authenticated connections.opsec_sic_name <LEA client SIC name>is the SIC name of the LEA client for authenticated connections.lea_server opsec_entity_sic_name <LEA server SIC name>is the SIC name of your FW1 management station when using authenticated connections.
fw1-loggrabber.conf file
This paragraph deals with the options that can be set within the configuration file. The default configuration file is fw1-loggrabber.conf (see --configfile option to use a different configuration file). The precedence of given options is as follows: command line, configuration file, default value. E.g. if you set the resolve-mode to be used in the configuration file, this can be overwritten by command line option --noresolve; only if an option isn’t set neither on command line nor in the configuration file, the default value will be used.
DEBUG_LEVEL=<0-3>sets the debug level to the specified value; zero means no output of debug information, and further levels will cause output of program specific as well as OPSEC specific debug information.FW1_LOGFILE=<name of log file>specifies the name of the FW1 logfile to be read; this can be either done exactly or using only a part of the filename; if no exact match can be found in the list of logfiles returned by the FW-1 management station, all logfiles which contain the specified string are processed; if this parameter is omitted, the default logfilefw.logwill be processed.FW1_OUTPUT=<files|logs>specifies whether FW1-LogGrabber should only display the available logfiles (files) on the FW11 server or display the content of these logfiles (logs).FW1_TYPE=<ng|2000>choose which version of FW1 to connect to; for Checkpoint FW-1 5.0 you have to specifyNGand for Checkpoint FW-1 4.1 you have to specify2000.FW1_MODE=<audit|normal>specifies whether to displayauditlogs, which contain administrative actions, ornormalsecurity logs, which contain data about dropped and accepted connections.MODE=<online|online-resume|offline>when using online mode, FW1-LogGrabber starts retrieving logging data from the end of the specified logfile and displays all future log entries (mainly used for continuously processing); the online-resume mode is similar to the online mode, but if FW1-LogGrabber is stopped and started again, it resumes processing from where it was stopped; if you instead choose the offline mode, FW1-LogGrabber quits after having displayed the last log entry.RESOLVE_MODE=<yes|no>with this option (enabled by default), IP addresses will be resolved to names using FW1 name resolving behaviour; this resolving mechanism will not cause the machine running FW1-LogGrabber to initiate DNS requests, but the name resolution will be done directly on the FW1 machine; if you disable resolving mode, IP addresses will be displayed in log output instead of names.RECORD_SEPARATOR=<char>can be used to change the default record separator|(pipe) into another character; if you choose a character which is contained in some log data, the occurrence within the logdata will be escaped by a backslash.LOGGING_CONFIGURATION=<screen|file|syslog>can be used for redirecting logging output to other destinations than the default destinationSTDOUT; currently it is possible to redirect output to a file or to the syslog daemon.OUTPUT_FILE_PREFIX=<prefix of output file>when using file output, this parameter defines a prefix for the output filename; default value is simplyfw1-loggrabber.OUTPUT_FILE_ROTATESIZE=<rotatesize in bytes>when using file output, this parameter specifies the maximum size of the output files, before they will be rotated with suffix-YYYY-MM-DD-hhmmss[-x].log; default value is 1048576 bytes, which equals 1 MB; setting a zero value disables file rotation.SYSLOG_FACILITY=<USER|LOCAL0|...|LOCAL7>when using syslog output, this parameter sets the syslog facility to be used.FW1_FILTER_RULE="<filterexpression1>[;<filterexpression2>]"defines filters fornormallog mode; you can find a more detailed description of filter rules, along with some examples, in a separate chapter below.AUDIT_FILTER_RULE="<filterexpression1>[;<filterexpression2>]"defines filters forauditlog mode; you can find a more detailed description of filter rules, along with some examples, in a separate chapter below.
Command line options
In the following section, all available command line options are described in detail. Most of the options can also be configured using the file fw1-loggrabber.conf (see --configfile option to use a different configuration file). The precedence of given options is as follows: command line, configuration file, default value. E.g. if you set the resolve-mode to be used in the configuration file, this can be overwritten by command line option --noresolve; only if an option isn’t set neither on command line nor in the configuration file, the default value will be used.
Help
Use --help to display basic help and usage information.
Debug level
The --debuglevel option sets the debug level to the specified value. A zero debug level means no output of debug information, while further levels will cause output of program specific as well as OPSEC specific debug
information.
Location of configuration files
The -c <configfilename> or --configfile <configfilename> options allow to specify a non-default configuration file, in which most of the command line options can be configured, as well as other options which are not available as command line parameters.
If this parameter is omitted, the file fw1-loggrabber.conf inside $LOGGRABBER_CONFIG_PATH will be used. See above for a description of all available configuration file options.
Using -l <leaconfigfilename> or --leaconfigfile <leaconfigfilename> instead, it’s possible to use a non-default LEA configuration file. In this file, all connection parameters such as FW1 server, port, authentication method as well as SIC names have to be configured, as usual procedure for OPSEC applications.
If this parameter is omitted, the file lea.conf inside $LOGGRABBER_CONFIG_PATH will be used. See above for a description of all available LEA configuration file options.
Remote log files
With -f <logfilename|pattern|ALL> or --logfile <logfilename|pattern|ALL> you can specify the name of the remote FW1 logfile to be read.
This can be either done exactly or using only a part of the filename. If no exact match can be found in the list of logfiles returned by the FW1 management station, all logfiles which contain the specified string are processed.
A special case is the usage of ALL instead of a logfile name or pattern. In that case all logfiles that are available on the management station, will be processed. If this parameter is omitted, only the default logfile fw.log will be processed.
The first example displays the logfile 2003-03-27_213652.log, while the second one processes all logfiles which contain 2003-03 in their filename.
--logfile 2003-03-27_213652.log
--logfile 2003-03
The default behaviour of FW1-LogGrabber is to display the content of the logfiles and not just their names. This can be explicitely specified using the --showlogs option.
The option --showfiles can be used instead to simply show the available logfiles on the FW1 management station. After the names of the logfiles have been displayed, FW1-LogGrabber quits.
Name resolving behaviour
Using the --resolve option, IP addresses will be resolved to names using FW1 name resolving behaviour. This resolving mechanism will not cause the machine running FW1-LogGrabber to initiate DNS requests, but the name resolution will be done directly on the FW1 machine.
This is the default behavior of FW1-LogGrabber which can be disabled by using --no-resolve. That option will cause IP addresses to be displayed in log output instead of names.
Checkpoint firewall version
The default FW1 version, for which this tool is being developed, is Checkpoint FW1 5.0 (NG) and above. If no other version is explicitly specified, the default version is --ng.
The option --2000 has to be used if you want to connect to older Checkpoint FW1 4.1 (2000) firewalls. You should keep in mind that some options are not available for non-NG firewalls; these include --auth, --showfiles, --auditlog and some more.
Online and Online-Resume modes
Using --online mode, FW1-LogGrabber starts output of logging data at the end of the specified logfile (or fw.log if no logfile name has been specified). This mode is mainly used for continuously processing FW1 log data and continues to display log entries also after scheduled and manual log switches. If you use --logfile to specify another logfile to be processed, you have to consider that no data will be shown, if the file isn’t active anymore.
The --online-resume mode is similar to the above online mode, but starts output of logging data at the last known processed position (which is stored inside a cursor).
In contrast to online mode, when using --offline mode FW1-LogGrabber quits after having displayed the last
log entry. This is the default behavior and is mainly used for analysis of historic log data.
Audit and normal logs
Using the --auditlog mode, content of the audit logfile (fw.adtlog) can be displayed. This includes administrator actions and uses different fields than normal log data.
The default --normallog mode of FW1-LogGrabber processes normal FW1 logfiles. In contrast to the --auditlog option, no administrative actions are displayed in this mode, but all regular log data is.
Filtering
Filter rules provide the possibility to display only log entries that match a given set of rules. There can be
specified one or more filter rules using one or multiple --filter arguments on the command line.
All individual filter rules are related by OR. That means a log entry will be displayed if at least one of the filter rules matches. You can specify multiple argument values by separating the values by , (comma).
Within one filter rule, there can be specified multiple arguments which have to be separated by ; (semi-colon). All these arguments are related by AND. That means a filter rule matches a given log entry only, if all of the filter arguments match.
If you specify != instead of = between name and value of the filter argument, you can negate the name/value pair.
For arguments that expect IP addresses, you can specify either a single IP address, multiple IP addresses separated by , (comma) or a network address with netmask (e.g. 10.0.0.0/255.0.0.0). Currently it is not possible to specify a network address and a single IP address within the same filter argument.
Supported filter arguments
Normal mode:
action=<ctl|accept|drop|reject|encrypt|decrypt|keyinst>
dst=<IP address>
endtime=<YYYYMMDDhhmmss>
orig=<IP address>
product=<VPN-1 & FireWall-1|SmartDefense>
proto=<icmp|tcp|udp>
rule=<rulenumber|startrule-endrule>
service=<portnumber|startport-endport>
src=<IP address>
starttime=<YYYYMMDDhhmmss>
Audit mode:
action=<ctl|accept|drop|reject|encrypt|decrypt|keyinst>
administrator=<string>
endtime=<YYYYMMDDhhmmss>
orig=<IP address>
product=<SmartDashboard|Policy Editor|SmartView Tracker|SmartView Status|SmartView Monitor|System Monitor|cpstat_monitor|SmartUpdate|CPMI Client>
starttime=<YYYYMMDDhhmmss>
Example filters
Display all dropped connections:
--filter "action=drop"
Display all dropped and rejected connections:
--filter "action=drop,reject"
--filter "action!=accept"
Display all log entries generated by rules 20 to 23:
--filter "rule=20,21,22,23"
--filter "rule=20-23"
Display all log entries generated by rules 20 to 23, 30 or 40 to 42:
--filter "rule=20-23,30,40-42"
Display all log entries to 10.1.1.1 and 10.1.1.2:
--filter "dst=10.1.1.1,10.1.1.2"
Display all log entries from 192.168.1.0/255.255.255.0:
--filter "src=192.168.1.0/255.255.255.0"
Display all log entries starting from 2004/03/02 14:00:00:
--filter "starttime=20040302140000"
Checkpoint device configuration
Modify $FWDIR/conf/fwopsec.conf and define the port to be used for authenticated LEA connections (e.g. 18184):
lea_server port 0
lea_server auth_port 18184
lea_server auth_type sslca
Restart in order to activate changes:
cpstop; cpstart
Create a new OPSEC Application Object with the following details:
Name: e.g. myleaclient
Vendor: User Defined
Server Entities: None
Client Entities: LEA
Initialize Secure Internal Communication (SIC) for recently created OPSEC Application Object and enter (and remember) the activation key (e.g. def456).
Write down the DN of the recently created OPSEC Application Object; this is your Client Distinguished Name, which you need later on.
Open the object of your FW1 management server and write down the DN of that object; this is the Server Distinguished Name, which you will need later on.
Add a rule to the policy to allow the port defined above as well as port 18210/tcp (FW1_ica_pull) in order to allow pulling of PKCS#12 certificate by the FW1-LogGrabber machine from the FW1 management server. Port 18210/tcp can be shut down after the communication between FW1-LogGrabber and the FW1 management server has been established successfully.
Finally, install the policy.
FW1-LogGrabber configuration
Modify $LOGGRABBER_CONFIG_PATH/lea.conf and define the IP address of your FW1 management station (e.g. 10.1.1.1) as well as port (e.g. 18184), authentication type and SIC names for authenticated LEA
connections. You can get the SIC names from the object properties of your LEA client object, respectively the
Management Station object (see above for details about Client DN and Server DN).
lea_server ip 10.1.1.1
lea_server auth_port 18184
lea_server auth_type sslca
opsec_sslca_file opsec.p12
opsec_sic_name "CN=myleaclient,O=cpmodule..gysidy"
lea_server opsec_entity_sic_name "cn=cp_mgmt,o=cpmodule..gysidy"
Get the tool opsec_pull_cert either from opsec-tools.tar.gz from the project home page or directly from the OPSEC SDK. This tool is needed to establish the Secure Internal Communication (SIC) between FW1-LogGrabber and the FW1 management server.
Get the clients certificate from the management station (e.g. 10.1.1.1). The activation key has to be the same as specified before in the firewall policy. After that, copy the resulting PKCS#12 file (default name opsec.p12) to your FW1-LogGrabber directory.
opsec_pull_cert -h 10.1.1.1 -n myleaclient -p def456
Authenticated SSL OPSEC connections
Checkpoint device configuration
Modify $FWDIR/conf/fwopsec.conf and define the port to be used for authenticated LEA connections (e.g. 18184):
lea_server port 0
lea_server auth_port 18184
lea_server auth_type ssl_opsec
Restart in order to activate changes:
cpstop; cpstart
Set a password (e.g. abc123) for the LEA client (e.g. 10.1.1.2):
fw putkey -ssl -p abc123 10.1.1.2
Create a new OPSEC Application Object with the following details:
Name: e.g. myleaclient
Vendor: User Defined
Server Entities: None
Client Entities: LEA
Initialize Secure Internal Communication (SIC) for recently created OPSEC Application Object and enter (and remember) the activation key (e.g. def456).
Write down the DN of the recently created OPSEC Application Object; this is your Client Distinguished Name, which you need later on.
Open the object of your FW1 management server and write down the DN of that object; this is the Server Distinguished Name, which you will need later on.
Add a rule to the policy to allow the port defined above as well as port 18210/tcp (FW1_ica_pull) in order to allow pulling of PKCS#12 certificate from the FW1-LogGrabber machine to the FW1 management server. The port 18210/tcp can be shut down after the communication between FW1-LogGrabber and the FW1 management server has been established successfully.
Finally, install the policy.
FW1-LogGrabber configuration
Modify $LOGGRABBER_CONFIG_PATH/lea.conf and define the IP address of your FW1 management station (e.g. 10.1.1.1) as well as port (e.g. 18184), authentication type and SIC names for authenticated LEA connections. The SIC names you can get from the object properties of your LEA client object respectively the Management Station object (see above for details about Client DN and Server DN).
lea_server ip 10.1.1.1
lea_server auth_port 18184
lea_server auth_type ssl_opsec
opsec_sslca_file opsec.p12
opsec_sic_name "CN=myleaclient,O=cpmodule..gysidy"
lea_server opsec_entity_sic_name "cn=cp_mgmt,o=cpmodule..gysidy"
Set password for the connection to the LEA server. The password has to be the same as specified on the LEA server.
opsec_putkey -ssl -p abc123 10.1.1.1
Get the tool opsec_pull_cert either from opsec-tools.tar.gz from the project home page or directly from the OPSEC SDK. This tool is needed to establish the Secure Internal Communication (SIC) between FW1-LogGrabber and the FW1 management server.
Get the clients certificate from the management station (e.g. 10.1.1.1). The activation key has to be the same as specified before in the firewall policy.
opsec_pull_cert -h 10.1.1.1 -n myleaclient -p def456
Authenticated OPSEC connections
Checkpoint device configuration
Modify $FWDIR/conf/fwopsec.conf and define the port to be used for authenticated LEA connections (e.g. 18184):
lea_server port 0
lea_server auth_port 18184
lea_server auth_type auth_opsec
Restart in order to activate changes
fwstop; fwstart
Set a password (e.g. abc123) for the LEA client (e.g. 10.1.1.2).
fw putkey -opsec -p abc123 10.1.1.2
Add a rule to the policy to allow the port defined above from the FW1-LogGrabber machine to the FW1 management server.
Finally, install the policy.
FW1-LogGrabber configuration
Modify $LOGGRABBER_CONFIG_PATH/lea.conf and define the IP address of your FW1 management station (e.g. 10.1.1.1) as well as port (e.g. 18184) and authentication type for authenticated LEA connections:
lea_server ip 10.1.1.1
lea_server auth_port 18184
lea_server auth_type auth_opsec
Set password for the connection to the LEA server. The password has to be the same as specified on the LEA server.
opsec_putkey -p abc123 10.1.1.1
Unauthenticated connections
Checkpoint device configuration
Modify $FWDIR/conf/fwopsec.conf and define the port to be used for unauthenticated LEA connections (e.g. 50001):
lea_server port 50001
lea_server auth_port 0
Restart in order to activate changes:
fwstop; fwstart  # for 4.1
cpstop; cpstart  # for NG
Add a rule to the policy to allow the port defined above from the FW1-LogGrabber machine to the FW1 management server.
Finally, install the policy.
FW1-LogGrabber configuration
Modify $LOGGRABBER_CONFIG_PATH/lea.conf and define the IP address of your FW1 management station (e.g. 10.1.1.1) and port (e.g. 50001) for unauthenticated LEA connections:
lea_server ip 10.1.1.1
lea_server port 50001
Logstash - Input SDEE
This Logstash input plugin allows you to call a Cisco SDEE/CIDEE HTTP API, decode the output of it into event(s), and send them on their merry way. The idea behind this plugins came from a need to gather events from Cisco security devices and feed them to ELK stack
Download
Only support for Logstash core 5.6.4.
Download link: https://rubygems.org/gems/logstash-input-sdee
Installation
gem install logstash-input-sdee-0.7.8.gem
Configuration
You need to import host SSL certificate in Java trust store to be able to connect to Cisco IPS device.
Get server certificate from IPS device:
echo | openssl s_client -connect ciscoips:443 2>&1 | sed -ne '/-BEGIN CERTIFICATE-/,/-END CERTIFICATE-/p' > cert.pem
Import it into Java ca certs:
$JAVA_HOME/bin/keytool -keystore $JAVA_HOME/lib/security/cacerts -importcert -alias ciscoips -file cert.pem
Verify if import was successful:
$JAVA_HOME/bin/keytool -keystore $JAVA_HOME/lib/security/cacerts -list
Setup the Logstash input config with SSL connection:
input {
  sdee {
    interval => 60
    http => {
      truststore_password => "changeit"
      url => "https://10.0.2.1"
      auth => {
        user => "cisco"
        password => "p@ssw0rd"
      }
    }
  }
}
Logstash - Input XML
To download xml files via Logstash use input “file”, and set the location of the files in the configuration file:
file {
       path => [ "/etc/logstash/files/*.xml" ]
       mode => "read"
  }
The XML filter takes a field that contains XML and expands it into an actual datastructure.
filter {
      xml {
        source => "message"
      }
    }
More configuration options you can find: https://www.elastic.co/guide/en/logstash/6.8/plugins-filters-xml.html#plugins-filters-xml-options
Logstash - Input WMI
The Logstash input wmi allow to collect data from WMI query. This is useful for collecting performance metrics and other data which is accessible via WMI on a Windows host.
Installation
For plugins not bundled by default, it is easy to install by running:
/usr/share/logstash/bin/logstash-plugin install logstash-input-wmi
Configuration
Configuration example:
input {
      wmi {
        query => "select * from Win32_Process"
        interval => 10
      }
      wmi {
        query => "select PercentProcessorTime from Win32_PerfFormattedData_PerfOS_Processor where name = '_Total'"
      }
      wmi { # Connect to a remote host
        query => "select * from Win32_Process"
        host => "MyRemoteHost"
        user => "mydomain\myuser"
        password => "Password"
      }
    }
More about parameters: https://www.elastic.co/guide/en/logstash/6.8/plugins-inputs-wmi.html#plugins-inputs-wmi-options
Logstash - Filter “beats syslog”
This filter processing an event data with syslog type:
	filter {

	 if [type] == "syslog" {
			grok {
					match => {
					  "message" => [
					# auth: ssh|sudo|su

					  "%{SYSLOGTIMESTAMP:[system][auth][timestamp]} %{SYSLOGHOST:[system][auth][hostname]} sshd(?:\[%{POSINT:[system][auth][pid]}\])?: %{DATA:[system][auth][ssh][event]} %{DATA:[system][auth][ssh][method]} for (invalid user )?%{DATA:[system][auth][user]} from %{IPORHOST:[system][auth][ssh][ip]} port %{NUMBER:[system][auth][ssh][port]} ssh2(: %{GREEDYDATA:[system][auth][ssh][signature]})?",

							  "%{SYSLOGTIMESTAMP:[system][auth][timestamp]} %{SYSLOGHOST:[system][auth][hostname]} sshd(?:\[%{POSINT:[system][auth][pid]}\])?: %{DATA:[system][auth][ssh][event]} user %{DATA:[system][auth][user]} from %{IPORHOST:[system][auth][ssh][ip]}",

							  "%{SYSLOGTIMESTAMP:[system][auth][timestamp]} %{SYSLOGHOST:[system][auth][hostname]} sshd(?:\[%{POSINT:[system][auth][pid]}\])?: Did not receive identification string from %{IPORHOST:[system][auth][ssh][dropped_ip]}",

							  "%{SYSLOGTIMESTAMP:[system][auth][timestamp]} %{SYSLOGHOST:[system][auth][hostname]} sudo(?:\[%{POSINT:[system][auth][pid]}\])?: \s*%{DATA:[system][auth][user]} :( %{DATA:[system][auth][sudo][error]} ;)? TTY=%{DATA:[system][auth][sudo][tty]} ; PWD=%{DATA:[system][auth][sudo][pwd]} ; USER=%{DATA:[system][auth][sudo][user]} ; COMMAND=%{GREEDYDATA:[system][auth][sudo][command]}",

							  "%{SYSLOGTIMESTAMP:[system][auth][timestamp]} %{SYSLOGHOST:[system][auth][hostname]} %{DATA:[system][auth][program]}(?:\[%{POSINT:[system][auth][pid]}\])?: %{GREEDYMULTILINE:[system][auth][message]}",

					# add/remove user or group
							  "%{SYSLOGTIMESTAMP:[system][auth][timestamp]} %{SYSLOGHOST:[system][auth][hostname]} groupadd(?:\[%{POSINT:[system][auth][pid]}\])?: new group: name=%{DATA:system.auth.groupadd.name}, GID=%{NUMBER:system.auth.groupadd.gid}",

					  "%{SYSLOGTIMESTAMP:[system][auth][timestamp]} %{SYSLOGHOST:[system][auth][hostname]} userdel(?:\[%{POSINT:[system][auth][pid]}\])?: removed group '%{DATA:[system][auth][groupdel][name]}' owned by '%{DATA:[system][auth][group][owner]}'",

							  "%{SYSLOGTIMESTAMP:[system][auth][timestamp]} %{SYSLOGHOST:[system][auth][hostname]} useradd(?:\[%{POSINT:[system][auth][pid]}\])?: new user: name=%{DATA:[system][auth][user][add][name]}, UID=%{NUMBER:[system][auth][user][add][uid]}, GID=%{NUMBER:[system][auth][user][add][gid]}, home=%{DATA:[system][auth][user][add][home]}, shell=%{DATA:[system][auth][user][add][shell]}$",

					   "%{SYSLOGTIMESTAMP:[system][auth][timestamp]} %{SYSLOGHOST:[system][auth][hostname]} userdel(?:\[%{POSINT:[system][auth][pid]}\])?: delete user '%{WORD:[system][auth][user][del][name]}'$",

					   "%{SYSLOGTIMESTAMP:[system][auth][timestamp]} %{SYSLOGHOST:[system][auth][hostname]} usermod(?:\[%{POSINT:[system][auth][pid]}\])?: add '%{WORD:[system][auth][user][name]}' to group '%{WORD:[system][auth][user][memberof]}'",

					   # yum install/erase/update package
					   "%{SYSLOGTIMESTAMP:[system][auth][timestamp]} %{DATA:[system][package][action]}: %{NOTSPACE:[system][package][name]}"
					]

				}

					pattern_definitions => {
					  "GREEDYMULTILINE"=> "(.|\n)*"
					}
				  }

				date {
						match => [ "[system][auth][timestamp]",
						"MMM  d HH:mm:ss",
					"MMM dd HH:mm:ss"
					]
					target => "[system][auth][timestamp]"
				}

				mutate {
				  convert => { "[system][auth][pid]" => "integer" }
				  convert => { "[system][auth][groupadd][gid]" => "integer" }
				  convert => { "[system][auth][user][add][uid]" => "integer" }
				  convert => { "[system][auth][user][add][gid]" => "integer" }
				}
	  }
	}
Logstash - Filter “network”
This filter processing an event data with network type:
filter {
 if [type] == "network" {
     grok {
		named_captures_only => true
		match => {
			"message" => [

			# Cisco Firewall
			"%{SYSLOG5424PRI}%{NUMBER:log_sequence#}:%{SPACE}%{IPORHOST:device_ip}: (?:.)?%{CISCOTIMESTAMP:log_data} CET: %%{CISCO_REASON:facility}-%{INT:severity_level}-%{CISCO_REASON:facility_mnemonic}:%{SPACE}%{GREEDYDATA:event_message}",

			# Cisco Routers
			"%{SYSLOG5424PRI}%{NUMBER:log_sequence#}:%{SPACE}%{IPORHOST:device_ip}: (?:.)?%{CISCOTIMESTAMP:log_data} CET: %%{CISCO_REASON:facility}-%{INT:severity_level}-%{CISCO_REASON:facility_mnemonic}:%{SPACE}%{GREEDYDATA:event_message}",

			# Cisco Switches
			"%{SYSLOG5424PRI}%{NUMBER:log_sequence#}:%{SPACE}%{IPORHOST:device_ip}: (?:.)?%{CISCOTIMESTAMP:log_data} CET: %%{CISCO_REASON:facility}-%{INT:severity_level}-%{CISCO_REASON:facility_mnemonic}:%{SPACE}%{GREEDYDATA:event_message}",
			"%{SYSLOG5424PRI}%{NUMBER:log_sequence#}:%{SPACE}(?:.)?%{CISCOTIMESTAMP:log_data} CET: %%{CISCO_REASON:facility}-%{INT:severity_level}-%{CISCO_REASON:facility_mnemonic}:%{SPACE}%{GREEDYDATA:event_message}",

			# HP switches
			"%{SYSLOG5424PRI}%{SPACE}%{CISCOTIMESTAMP:log_data} %{IPORHOST:device_ip} %{CISCO_REASON:facility}:%{SPACE}%{GREEDYDATA:event_message}"
			]

		}
	}

	syslog_pri { }

	if [severity_level] {

	  translate {
	    dictionary_path => "/etc/logstash/dictionaries/cisco_syslog_severity.yml"
	    field => "severity_level"
	    destination => "severity_level_descr"
	  }

	}

	if [facility] {

	  translate {
	    dictionary_path => "/etc/logstash/dictionaries/cisco_syslog_facility.yml"
	    field => "facility"
	    destination => "facility_full_descr"
	  }

	}

	 #ACL
	 if [event_message] =~ /(\d+.\d+.\d+.\d+)/ {
	  grok {
	    match => {
		"event_message" => [
			"list %{NOTSPACE:[acl][name]} %{WORD:[acl][action]} %{WORD:[acl][proto]} %{IP:[src][ip]}.*%{IP:[dst][ip]}",
			"list %{NOTSPACE:[acl][name]} %{WORD:[acl][action]} %{IP:[src][ip]}",
			"^list %{NOTSPACE:[acl][name]} %{WORD:[acl][action]} %{WORD:[acl][proto]} %{IP:[src][ip]}.*%{IP:[dst][ip]}"
			]
	    }
	  }
	}

	if [src][ip] {

		cidr {
		   address => [ "%{[src][ip]}" ]
		   network => [ "0.0.0.0/32", "10.0.0.0/8", "172.16.0.0/12", "192.168.0.0/16", "fc00::/7", "127.0.0.0/8", "::1/128", "169.254.0.0/16", "fe80::/10","224.0.0.0/4", "ff00::/8","255.255.255.255/32"  ]
		   add_field => { "[src][locality]" => "private" }
		}

		if ![src][locality] {
		   mutate {
		      add_field => { "[src][locality]" => "public" }
		   }
		}
	}


	if [dst][ip] {
		cidr {
		   address => [ "%{[dst][ip]}" ]
		   network => [ "0.0.0.0/32", "10.0.0.0/8", "172.16.0.0/12", "192.168.0.0/16", "fc00::/7", "127.0.0.0/8", "::1/128",
				"169.254.0.0/16", "fe80::/10","224.0.0.0/4", "ff00::/8","255.255.255.255/32" ]
		   add_field => { "[dst][locality]" => "private" }
		}

		if ![dst][locality] {
		   mutate {
		      add_field => { "[dst][locality]" => "public" }
		   }
		}
	}

	# date format
	date {
	  match => [ "log_data",
		"MMM dd HH:mm:ss",
		"MMM  dd HH:mm:ss",
		"MMM dd HH:mm:ss.SSS",
		"MMM  dd HH:mm:ss.SSS",
		"ISO8601"
	  ]
	  target => "log_data"
	}

 }
}
Logstash - Filter “geoip”
This filter processing an events data with IP address and check localization:
filter {
     if [src][locality] == "public" {

		geoip {
			source => "[src][ip]"
			target => "[src][geoip]"
			database => "/etc/logstash/geoipdb/GeoLite2-City.mmdb"
			fields => [ "city_name", "country_name", "continent_code", "country_code2", "location" ]
			remove_field => [ "[src][geoip][ip]" ]
		}

		geoip {
			source => "[src][ip]"
			target => "[src][geoip]"
			database => "/etc/logstash/geoipdb/GeoLite2-ASN.mmdb"
			remove_field => [ "[src][geoip][ip]" ]
		}

     }

     if [dst][locality] == "public" {

		geoip {
			source => "[dst][ip]"
			target => "[dst][geoip]"
			database => "/etc/logstash/geoipdb/GeoLite2-City.mmdb"
			fields => [ "city_name", "country_name", "continent_code", "country_code2", "location" ]
			remove_field =>  [ "[dst][geoip][ip]" ]
		}

		geoip {
			source => "[dst][ip]"
			target => "[dst][geoip]"
			database => "/etc/logstash/geoipdb/GeoLite2-ASN.mmdb"
			remove_field => [ "[dst][geoip][ip]" ]
		}
     }

}
Logstash avoiding duplicate documents
To avoid duplicating the same documents, e.g. if the collector receives the entire event log file on restart, prepare the Logstash filter as follows:
Use the fingerprint Logstash filter to create consistent hashes of one or more fields whose values are unique for the document and store the result in a new field, for example:
fingerprint {
                        source => [ "log_name", "record_number" ]
                        target => "generated_id"
                        method => "SHA1"
                }
- source - The name(s) of the source field(s) whose contents will be used to create the fingerprint
- target - The name of the field where the generated fingerprint will be stored. Any current contents of that field will be overwritten.
- method - If set to
SHA1,SHA256,SHA384,SHA512, orMD5and a key is set, the cryptographic hash function with the same name will be used to generate the fingerprint. When a key set, the keyed-hash (HMAC) digest function will be used.
In the elasticsearch output set the document_id as the value of the generated_id field:
elasticsearch {
                hosts => ["http://localhost:9200"]
                user => "logserver"
                password => "logserver"
                index => "syslog_wec-%{+YYYY.MM.dd}"
                document_id => "%{generated_id}"
        }
- document_id - The document ID for the index. Useful for overwriting existing entries in Elasticsearch with the same ID.
Documents having the same document_id will be indexed only once.
Logstash data enrichment
It is possible to enrich the events that go to the logstash filters with additional fields, the values of which come from the following sources:
- databases, using the
jdbcplugin; - Active Directory or OpenLdap, using the
logstash-filter-ldapplugin; - dictionary files, using the
translateplugin; - external systems using their API, e.g. OP5 Monitor/Nagios
Filter jdbc
This filter executes a SQL query and store the result set in the field specified as target. It will cache the results locally in an LRU cache with expiry.
For example, you can load a row based on an id in the event:
filter {
  jdbc_streaming {
    jdbc_driver_library => "/path/to/mysql-connector-java-5.1.34-bin.jar"
    jdbc_driver_class => "com.mysql.jdbc.Driver"
    jdbc_connection_string => "jdbc:mysql://localhost:3306/mydatabase"
    jdbc_user => "me"
    jdbc_password => "secret"
    statement => "select * from WORLD.COUNTRY WHERE Code = :code"
    parameters => { "code" => "country_code"}
    target => "country_details"
  }
}
More about jdbc plugin parameters: (https://www.elastic.co/guide/en/logstash/6.8/plugins-filters-jdbc_streaming.html
Filter logstash-filter-ldap
Download and installation
Configuration
The logstash-filter-ldap filter will add fields queried from a ldap server to the event. The fields will be stored in a variable called target, that you can modify in the configuration file.
If an error occurs during the process tha tags array of the event is updated with either:
- LDAP_ERROR tag: Problem while connecting to the server: bad host, port, username, password, or search_dn -> Check the error message and your configuration.
- LDAP_NOT_FOUND tag: Object wasn’t found.
If error logging is enabled a field called error will also be added to the event. It will contain more details about the problem.
Input event
{
    "@timestamp" => 2018-02-25T10:04:22.338Z,
    "@version" => "1",
    "myUid" => "u501565"
}
Logstash filter
filter {
  ldap {
    identifier_value => "%{myUid}"
    host => "my_ldap_server.com"
    ldap_port => "389"
    username => "<connect_username>"
    password => "<connect_password>"
    search_dn => "<user_search_pattern>"
  }
}
Output event
{
    "@timestamp" => 2018-02-25T10:04:22.338Z,
    "@version" => "1",
    "myUid" => "u501565",
    "ldap" => {
        "givenName" => "VALENTIN",
        "sn" => "BOURDIER"
    }
}
Parameters availables
Here is a list of all parameters, with their default value, if any, and their description.
|      Option name      | Type    | Required | Default value  | Description                                                  | Example                                   |
| :-------------------: | ------- | -------- | -------------- | ------------------------------------------------------------ | ----------------------------------------- |
|   identifier_value    | string  | yes      | n/a            | Identifier of the value to search. If identifier type is uid, then the value should be the uid to search for. | "123456"                                  |
|    identifier_key     | string  | no       | "uid"          | Type of the identifier to search                             | "uid"                                     |
|    identifier_type    | string  | no       | "posixAccount" | Object class of the object to search                         | "person"                                  |
|       search_dn       | string  | yes      | n/a            | Domain name in which search inside the ldap database (usually your userdn or groupdn) | "dc=example,dc=org"                       |
|      attributes       | array   | no       | []             | List of attributes to get. If not set, all attributes available will be get | ['givenName', 'sn']                       |
|        target         | string  | no       | "ldap"         | Name of the variable you want the result being stocked in    | "myCustomVariableName"                    |
|         host          | string  | yes      | n/a            | LDAP server host adress                                      | "ldapserveur.com"                         |
|       ldap_port       | number  | no       | 389            | LDAP server port for non-ssl connection                      | 400                                       |
|      ldaps_port       | number  | no       | 636            | LDAP server port for ssl connection                          | 401                                       |
|        use_ssl        | boolean | no       | false          | Enable or not ssl connection for LDAP  server. Set-up the good ldap(s)_port depending on that | true                                      |
| enable_error_logging  | boolean | no       | false          | When there is a problem with the connection with the LDAP database, write reason in the event | true                                      |
|   no_tag_on_failure   | boolean | no       | false          | No tags are added when an error (wrong credentials, bad server, ..) occur | true                                      |
|       username        | string  | no       | n/a            | Username to use for search in the database                   | "cn=SearchUser,ou=person,o=domain"        |
|       password        | string  | no       | n/a            | Password of the account linked to previous username          | "123456"                                  |
|       use_cache       | boolean | no       | true           | Choose to enable or not use of buffer                        | false                                     |
|      cache_type       | string  | no       | "memory"       | Type of buffer to use. Currently, only one is available, "memory" buffer | "memory"                                  |
| cache_memory_duration | number  | no       | 300            | Cache duration (in s) before refreshing values of it         | 3600                                      |
|   cache_memory_size   | number  | no       | 20000          | Number of object max that the buffer can contains            | 100                                       |
|  disk_cache_filepath  | string  | no       | nil            | Where the cache will periodically be dumped                  | "/tmp/my-memory-backup"                   |
|  disk_cache_schedule  | string  | no       | 10m            | Cron period of when the dump of the cache should occured. See [here](https://github.com/floraison/fugit) for the syntax. | "10m", "1h", "every day at five", "3h10m" |
Buffer
Like all filters, this filter treat only 1 event at a time. This can lead to some slowing down of the pipeline speed due to the network round-trip time, and high network I/O.
A buffer can be set to mitigate this.
Currently, there is only one basic “memory” buffer.
You can enable / disable use of buffer with the option use_cache.
Memory Buffer
This buffer store data fetched from the LDAP server in RAM, and can be configured with two parameters:
- cache_memory_duration: duration (in s) before a cache entry is refreshed if hit.
- cache_memory_size: number of tuple (identifier, attributes) that the buffer can contains.
Older cache values than your TTL will be removed from cache.
Persistant cache buffer
For the only buffer for now, you will be able to save it to disk periodically.
Some specificities :
- for the memory cache, TTL will be reset
Two parameters are required:
- disk_cache_filepath: path on disk of this backup
- disk_cache_schedule: schedule (every X time unit) of this backup. Please check here for the syntax of this parameter.
Filter translate
A general search and replace tool that uses a configured hash and/or a file to determine replacement values. Currently supported are YAML, JSON, and CSV files. Each dictionary item is a key value pair.
You can specify dictionary entries in one of two ways:
- The dictionary configuration item can contain a hash representing the mapping.
filter {
      translate {
        field => "[http_status]"
        destination => "[http_status_description]"
        dictionary => {
          "100" => "Continue"
          "101" => "Switching Protocols"
          "200" => "OK"
          "500" => "Server Error"
        }
        fallback => "I'm a teapot"
      }
    }
- An external file (readable by logstash) may be specified in the
dictionary_pathconfiguration item:
filter {
	translate {
		dictionary_path => "/etc/logstash/lists/instance_cpu.yml"
		field => "InstanceType"
		destination => "InstanceCPUCount"
		refresh_behaviour => "replace"
	}
}
Sample dictionary file:
"c4.4xlarge": "16"
"c5.xlarge": "4"
"m1.medium": "1"
"m3.large": "2"
"m3.medium": "1"
"m4.2xlarge": "8"
"m4.large": "2"
"m4.xlarge": "4"
"m5a.xlarge": "4"
"m5d.xlarge": "4"
"m5.large": "2"
"m5.xlarge": "4"
"r3.2xlarge": "8"
"r3.xlarge": "4"
"r4.xlarge": "4"
"r5.2xlarge": "8"
"r5.xlarge": "4"
"t2.large": "2"
"t2.medium": "2"
"t2.micro": "1"
"t2.nano": "1"
"t2.small": "1"
"t2.xlarge": "4"
"t3.medium": "2"
External API
A simple filter that checks if an IP (from PublicIpAddress field) address exists in an external system. The result is written to the op5exists field. Then, using a grok filter, the number of occurrences is decoded and put into the op5count field.
ruby {
	code => '
		checkip = event.get("PublicIpAddress")
		output=`curl -s -k -u monitor:monitor "https://192.168.1.1/api/filter/count?query=%5Bhosts%5D%28address%20~~%20%22#	{checkip}%22%20%29" 2>&1`
		event.set("op5exists", "#{output}")
	'
}
grok {
	match => { "op5exists" => [ ".*\:%{NUMBER:op5count}" ] }
}
Logstash - Output to Elasticsearch
This output plugin sends all data to the local Elasticsearch instance and create indexes:
output {
	elasticsearch {
	   hosts => [ "127.0.0.1:9200" ]

	   index => "%{type}-%{+YYYY.MM.dd}"

	   user => "logstash"
	   password => "logstash"
	}
}
Logstash plugin for “naemon beat”
This Logstash plugin has example of complete configuration for integration with naemon application:
input {
    beats {
        port => FILEBEAT_PORT
        type => "naemon"
    }
}

filter {
    if [type] == "naemon" {
        grok {
            patterns_dir => [ "/etc/logstash/patterns" ]
            match => { "message" => "%{NAEMONLOGLINE}" }
            remove_field => [ "message" ]
        }
        date {
            match => [ "naemon_epoch", "UNIX" ]
            target => "@timestamp"
            remove_field => [ "naemon_epoch" ]
        }
    }
}

output {
    # Single index
#    if [type] == "naemon" {
#        elasticsearch {
#            hosts => ["ELASTICSEARCH_HOST:ES_PORT"]
#            index => "naemon-%{+YYYY.MM.dd}"
#        }
#    }

    # Separate indexes
    if [type] == "naemon" {
        if "_grokparsefailure" in [tags] {
            elasticsearch {
                hosts => ["ELASTICSEARCH_HOST:ES_PORT"]
                index => "naemongrokfailure"
            }
        }
        else {
            elasticsearch {
                hosts => ["ELASTICSEARCH_HOST:ES_PORT"]
                index => "naemon-%{+YYYY.MM.dd}"
            }
        }
    }
}
Logstash plugin for “perflog”
This Logstash plugin has example of complete configuration for integration with perflog:
input {
  tcp {
    port => 6868
    host => "0.0.0.0"
    type => "perflogs"
  }
}

filter {
  if [type] == "perflogs" {
    grok {
      break_on_match => "true"
      match => {
        "message" => [
          "DATATYPE::%{WORD:datatype}\tTIMET::%{NUMBER:timestamp}\tHOSTNAME::%{DATA:hostname}\tSERVICEDESC::%{DATA:servicedescription}\tSERVICEPERFDATA::%{DATA:performance}\tSERVICECHECKCOMMAND::.*?HOSTSTATE::%{WORD:hoststate}\tHOSTSTATETYPE::.*?SERVICESTATE::%{WORD:servicestate}\tSERVICESTATETYPE::%{WORD:servicestatetype}",
          "DATATYPE::%{WORD:datatype}\tTIMET::%{NUMBER:timestamp}\tHOSTNAME::%{DATA:hostname}\tHOSTPERFDATA::%{DATA:performance}\tHOSTCHECKCOMMAND::.*?HOSTSTATE::%{WORD:hoststate}\tHOSTSTATETYPE::%{WORD:hoststatetype}"
          ]
        }
      remove_field => [ "message" ]
    }
    kv {
      source => "performance"
      field_split => "\t"
      remove_char_key => "\.\'"
      trim_key => " "
      target => "perf_data"
      remove_field => [ "performance" ]
      allow_duplicate_values => "false"
      transform_key => "lowercase"
    }
    date {
      match => [ "timestamp", "UNIX" ]
      target => "@timestamp"
      remove_field => [ "timestamp" ]
    }
  }
}

output {
  if [type] == "perflogs" {
    elasticsearch {
      hosts => ["127.0.0.1:9200"]
      index => "perflogs-%{+YYYY.MM.dd}"
    }
  }
}
Single password in all Logstash outputs
You can set passwords and other Logstash pipeline settings as environment variables. This can be useful if the password was changed for the logastash user and it must be to update in the configuration files.
Configuration steps:
Create the service file:
mkdir –p /etc/systemd/system/logstash.service.d vi /etc/systemd/system/logstash.service.d/logstash.conf
 	[Service]
 	Environment="ELASTICSEARCH_ES_USER=logserver"
 	Environment="ELASTICSEARCH_ES_PASSWD=logserver"
Reload systemctl daemon:
systemctl daemon-reload
Sample definition of Logstash output pipline seciotn:
 output  {
   elasticsearch {
     index => "test-%{+YYYY.MM.dd}"
     user => "${ELASTICSEARCH_ES_USER:elastic}"
     password => "${ELASTICSEARCH_ES_PASSWD:changeme}"
   }
 }
Secrets keystore for secure settings
When you configure Logstash, you can use the Logstash keystore to securely store secret values for use in configuration settings (passwords, usernames, other settings).
Configuration steps:
Set the keystore password
 vi /etc/sysconfi/logstash
 LOGSTASH_KEYSTORE_PASS=keystorepass
Create the new keystore:
/usr/share/logstash/bin/logstash-keystore create –path.settings /etc/logstash
During createation keystore you can provide the keysore passowrd
Add new entry to keystore:
usr/share/logstash/bin/logstash-keystore add ES_PWD --path.settings /etc/logstash
When adding an entry to the keystore, set the value of the entry.
Listing added entries:
/usr/share/logstash/bin/logstash-keystore list --path.settings /etc/logstash
Removing entries:
/usr/share/logstash/bin/logstash-keystore remove ES_PWD --path.settings /etc/logstash
Sample definition of Logstash output pipline seciotn:
	output  {
	  elasticsearch {
	    index => "test-%{+YYYY.MM.dd}"
	    user => "${ES_PWD}"
	    password => "${ES_PWD}"
	  }
	}
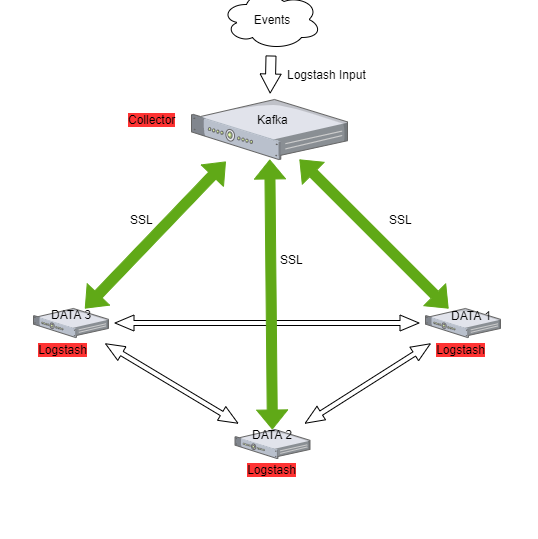
Enabling encryption for Apache Kafka clients
Kafka allows you to distribute the load between nodes receiving data and encrypts communication.
Architecture example:
The Kafka installation
Documentation during creation.
Enabling encryption in Kafka
Generate SSL key and certificate for each Kafka broker
keytool -keystore server.keystore.jks -alias localhost -validity {validity} -genkey -keyalg RSA
Configuring Host Name In Certificates
keytool -keystore server.keystore.jks -alias localhost -validity {validity} -genkey -keyalg RSA -ext SAN=DNS:{FQDN}
Verify content of the generated certificate:
keytool -list -v -keystore server.keystore.jks
Creating your own CA
openssl req -new -x509 -keyout ca-key -out ca-cert -days 365
keytool -keystore client.truststore.jks -alias CARoot -import -file ca-cert
keytool -keystore server.truststore.jks -alias CARoot -import -file ca-cert
Signing the certificate
keytool -keystore server.keystore.jks -alias localhost -certreq -file cert-file
openssl x509 -req -CA ca-cert -CAkey ca-key -in cert-file -out cert-signed -days {validity} -CAcreateserial -passin pass:{ca-password}
Import both the certificate of the CA and the signed certificate into the keystore
keytool -keystore server.keystore.jks -alias CARoot -import -file ca-cert
keytool -keystore server.keystore.jks -alias localhost -import -file cert-signed
Configuring Kafka Brokers
In /etc/kafka/server.properties file set the following options:
listeners=PLAINTEXT://host.name:port,SSL://host.name:port

ssl.keystore.location=/var/private/ssl/server.keystore.jks
ssl.keystore.password=test1234
ssl.key.password=test1234
ssl.truststore.location=/var/private/ssl/server.truststore.jks
ssl.truststore.password=test1234
and restart the Kafka service
systemctl restart kafka
Configuring Kafka Clients
Logstash
Configure the output section in Logstash based on the following example:
output {
  kafka {
    bootstrap_servers => "host.name:port"
    security_protocol => "SSL"
    ssl_truststore_type => "JKS"
    ssl_truststore_location => "/var/private/ssl/client.truststore.jks"
    ssl_truststore_password => "test1234"
    client_id => "host.name"
    topic_id => "Topic-1"
    codec => json
  }
}
Configure the input section in Logstash based on the following example:
input {
  kafka {
    bootstrap_servers => "host.name:port"
    security_protocol => "SSL"
    ssl_truststore_type => "JKS"
    ssl_truststore_location => "/var/private/ssl/client.truststore.jks"
    ssl_truststore_password => "test1234"
    consumer_threads => 4
    topics => [ "Topic-1" ]
    codec => json
    tags => ["kafka"]
   }
}