Integrations
OP5 - Naemon logs
Logstash
In ITRS Log Analytics
naemon_beat.confset upELASTICSEARCH_HOST,ES_PORT,FILEBEAT_PORTCopy ITRS Log Analytics
naemon_beat.confto/etc/logstash/conf.dBased on “FILEBEAT_PORT” if firewall is running:
sudo firewall-cmd --zone=public --permanent --add-port=FILEBEAT_PORT/tcp
sudo firewall-cmd --reload
Based on amount of data that elasticsearch will receive you can also choose whether you want index creation to be based on moths or days:
index => "ITRS Log Analytics-naemon-%{+YYYY.MM}"
or
index => "ITRS Log Analytics-naemon-%{+YYYY.MM.dd}"
Copy
naemonfile to/etc/logstash/patternsand make sure it is readable by logstash processRestart logstash configuration e.g.:
sudo systemct restart logstash
Elasticsearch
Connect to Elasticsearch node via SSH and Install index pattern for naemon logs. Note that if you have a default pattern covering settings section you should delete/modify that in naemon_template.sh:
"settings": {
    "number_of_shards": 5,
    "auto_expand_replicas": "0-1"
  },
./naemon_template.shITRS Log Analytics Monitor
On ITRS Log Analytics Monitor host install filebeat (for instance via rpm
https://www.elastic.co/downloads/beats/filebeat)In
/etc/filebeat/filebeat.ymladd:#=========================== Filebeat inputs ============================= filebeat.config.inputs: enabled: true path: configs/*.yml
You also will have to configure the output section in
filebeat.yml. You should have one logstash output:#----------------------------- Logstash output -------------------------------- output.logstash: # The Logstash hosts hosts: ["LOGSTASH_IP:FILEBEAT_PORT"]
If you have few logstash instances -
Logstashsection has to be repeated on every node andhosts:should point to all of them:hosts: ["LOGSTASH_IP:FILEBEAT_PORT", "LOGSTASH_IP:FILEBEAT_PORT", "LOGSTASH_IP:FILEBEAT_PORT" ]
Create
/etc/filebeat/configscatalog.Copy
naemon_logs.ymlto a newly created catalog.Check the newly added configuration and connection to logstash. Location of executable might vary based on os:
 /usr/share/filebeat/bin/filebeat --path.config /etc/filebeat/ test config
 /usr/share/filebeat/bin/filebeat --path.config /etc/filebeat/ test output
Restart filebeat:
 sudo systemctl restart filebeat # RHEL/CentOS 7
 sudo service filebeat restart # RHEL/CentOS 6
Elasticsearch
At this moment there should be a new index on the Elasticsearch node:
curl -XGET '127.0.0.1:9200/_cat/indices?v'
Example output:
	health status index                 uuid                   pri rep docs.count docs.deleted store.size pri.store.size
	green  open   ITRS Log Analytics-naemon-2018.11    gO8XRsHiTNm63nI_RVCy8w   1   0      23176            0      8.3mb          8.3mb
If the index has been created, in order to browse and visualise the data, “index pattern” needs to be added in Kibana.
OP5 - Performance data
Below instruction requires that between ITRS Log Analytics node and Elasticsearch node is working Logstash instance.
Elasticsearch
First, settings section in ITRS Log Analyticstemplate.sh should be adjusted, either:
there is a default template present on Elasticsearch that already covers shards and replicas then settings sections should be removed from the ITRS Log Analyticstemplate.sh before executing
there is no default template - shards and replicas should be adjusted for you environment (keep in mind replicas can be added later, while changing shards count on existing index requires reindexing it)
  "settings": {
    "number_of_shards": 5,
    "number_of_replicas": 0
  }
In URL ITRS Log Analyticsperfdata is a name for the template - later it can be search for or modify with it.
The “template” is an index pattern. New indices matching it will have the settings and mapping applied automatically (change it if you index name for ITRS Log Analytics perfdata is different).
Mapping name should match documents type:
"mappings": {
	  "ITRS Log Analyticsperflogs"
Running ITRS Log Analyticstemplate.sh will create a template (not index) for ITRS Log Analytics perf data documents.
Logstash
The ITRS Log Analyticsperflogs.conf contains example of input/filter/output configuration. It has to be copied to /etc/logstash/conf.d/. Make sure that the logstash has permissions to read the configuration files:
chmod 664 /etc/logstash/conf.d/ITRS Log Analyticsperflogs.confIn the input section comment/uncomment “beats” or “tcp” depending on preference (beats if Filebeat will be used and tcp if NetCat). The port and the type has to be adjusted as well:
port => PORT_NUMBER
type => "ITRS Log Analyticsperflogs"
In a filter section type has to be changed if needed to match the input section and Elasticsearch mapping.
In an output section type should match with the rest of a config. host should point to your elasticsearch node. index name should correspond with what has been set in elasticsearch template to allow mapping application. The date for index rotation in its name is recommended and depending on the amount of data expecting to be transferred should be set to daily (+YYYY.MM.dd) or monthly (+YYYY.MM) rotation:
hosts => ["127.0.0.1:9200"]
index => "ITRS Log Analytics-perflogs-%{+YYYY.MM.dd}"
Port has to be opened on a firewall:
sudo firewall-cmd --zone=public --permanent --add-port=PORT_NUMBER/tcp
sudo firewall-cmd --reload
Logstash has to be reloaded:
sudo systemctl restart logstash
or
sudo kill -1 LOGSTASH_PID
ITRS Log Analytics Monitor
You have to decide wether FileBeat or NetCat will be used. In case of Filebeat - skip to the second step. Otherwise:
Comment line:
54    open(my $logFileHandler, '>>', $hostPerfLogs) or die "Could not open $hostPerfLogs"; #FileBeat
•	Uncomment lines:
55 #    open(my $logFileHandler, '>', $hostPerfLogs) or die "Could not open $hostPerfLogs"; #NetCat
...
88 #    my $logstashIP = "LOGSTASH_IP";
89 #    my $logstashPORT = "LOGSTASH_PORT";
90 #    if (-e $hostPerfLogs) {
91 #        my $pid1 = fork();
92 #        if ($pid1 == 0) {
93 #            exec("/bin/cat $hostPerfLogs | /usr/bin/nc -w 30 $logstashIP $logstashPORT");
94 #        }
95 #    }
In process-service-perfdata-log.pl and process-host-perfdata-log.pl: change logstash IP and port:
92 my $logstashIP = "LOGSTASH_IP";
93 my $logstashPORT = "LOGSTASH_PORT";
In case of running single ITRS Log Analytics node, there is no problem with the setup. In case of a peered environment $do_on_host variable has to be set up and the script process-service-perfdata-log.pl/process-host-perfdata-log.pl has to be propagated on all of ITRS Log Analytics nodes:
16 $do_on_host = "EXAMPLE_HOSTNAME"; # ITRS Log Analytics node name to run the script on
17 $hostName = hostname; # will read hostname of a node running the script
Example of command definition (/opt/monitor/etc/checkcommands.cfg) if scripts have been copied to /opt/plugins/custom/:
# command 'process-service-perfdata-log'
define command{
    command_name                   process-service-perfdata-log
    command_line                   /opt/plugins/custom/process-service-perfdata-log.pl $TIMET$
    }
# command 'process-host-perfdata-log'
define command{
    command_name                   process-host-perfdata-log
    command_line                   /opt/plugins/custom/process-host-perfdata-log.pl $TIMET$
    }
In /opt/monitor/etc/naemon.cfg service_perfdata_file_processing_command and host_perfdata_file_processing_command has to be changed to run those custom scripts:
service_perfdata_file_processing_command=process-service-perfdata-log
host_perfdata_file_processing_command=process-host-perfdata-log
In addition service_perfdata_file_template and host_perfdata_file_template can be changed to support sending more data to Elasticsearch. For instance, by adding $HOSTGROUPNAMES$ and $SERVICEGROUPNAMES$ macros logs can be separated better (it requires changes to Logstash filter config as well)
Restart naemon service:
sudo systemctl restart naemon # CentOS/RHEL 7.x
sudo service naemon restart # CentOS/RHEL 7.x
If FileBeat has been chosen, append below to filebeat.conf (adjust IP and PORT):
filebeat.inputs:
type: log
enabled: true
paths:
  - /opt/monitor/var/service_performance.log
  - /opt/monitor/var/host_performance.log
tags: ["ITRS Log Analyticsperflogs"]
  output.logstash:
# The Logstash hosts
  hosts: ["LOGSTASH_IP:LOGSTASH_PORT"]
Restart FileBeat service:
sudo systemctl restart filebeat # CentOS/RHEL 7.x
sudo service filebeat restart # CentOS/RHEL 7.x
Kibana
At this moment there should be new index on the Elasticsearch node with performance data documents from ITRS Log Analytics Monitor.
Login to an Elasticsearch node and run: curl -XGET '127.0.0.1:9200/_cat/indices?v' Example output:
health status index                      pri rep docs.count docs.deleted store.size pri.store.size
green  open   auth                       5   0          7         6230      1.8mb          1.8mb
green  open   ITRS Log Analytics-perflogs-2018.09.14    5   0      72109            0     24.7mb         24.7mb
After a while, if there is no new index make sure that:
- Naemon is runnig on ITRS Log Analytics node
- Logstash service is running and there are no errors in: /var/log/logstash/logstash-plain.log
- Elasticsearch service is running an there are no errors in: /var/log/elasticsearch/elasticsearch.log
If the index has been created, in order to browse and visualize the data “index pattern” needs to be added to Kibana.
- After logging in to Kibana GUI go to Settings tab and add ITRS Log Analytics-perflogs-* pattern. Chose @timestamp time field and click Create.
- Performance data logs should be now accessible from Kibana GUI Discovery tab ready to be visualize.
OP5 Beat
The op5beat is small agent for collecting metrics from op5 Monitor.
The op5beat is located in the installation directory: utils/op5integration/op5beat
Installation for Centos7 and newer
Copy the necessary files to the appropriate directories:
cp -rf etc/* /etc/
cp -rf usr/* /usr/
cp -rf var/* /var/
Configure and start op5beat service (systemd):
cp -rf op5beat.service /usr/lib/systemd/system/
systemctl daemon-reload
systemctl enable op5beat
systemctl start op5beat
Installation for Centos6 and older
Copy the necessary files to the appropriate directories:
cp -rf etc/* /etc/
cp -rf usr/* /usr/
cp -rf var/* /var/
Configure and start op5beat service:
sysV init:
cp -rf op5beat.service /etc/rc.d/init.d/op5beat
chkconfig op5beat on
service op5beat start
supervisord (optional):
yum install supervisor
cp -rf supervisord.conf /etc/supervisord.conf
The Grafana instalation
To install the Grafana application you should:
add necessary repository to operating system:
[root@localhost ~]# cat /etc/yum.repos.d/grafan.repo
  [grafana]
  name=grafana
  baseurl=https://packagecloud.io/grafana/stable/el/7/$basearch
  repo_gpgcheck=1
  enabled=1
  gpgcheck=1
  gpgkey=https://packagecloud.io/gpg.key https://grafanarel.s3.amazonaws.com/RPM-GPG-KEY-grafana
  sslverify=1
  sslcacert=/etc/pki/tls/certs/ca-bundle.crt
  [root@localhost ~]#
install the Grafana with following commands:
 [root@localhost ~]# yum search grafana
  Loaded plugins: fastestmirror
  Loading mirror speeds from cached hostfile
   * base: ftp.man.szczecin.pl
   * extras: centos.slaskdatacenter.com
   * updates: centos.slaskdatacenter.com
  =========================================================================================================== N/S matched: grafana ===========================================================================================================
  grafana.x86_64 : Grafana
  pcp-webapp-grafana.noarch : Grafana web application for Performance Co-Pilot (PCP)

    Name and summary matches only, use "search all" for everything.

  [root@localhost ~]# yum install grafana
to run application use following commands:
 [root@localhost ~]# systemctl enable grafana-server
  Created symlink from /etc/systemd/system/multi-user.target.wants/grafana-server.service to /usr/lib/systemd/system/grafana-server.service.
  [root@localhost ~]#
  [root@localhost ~]# systemctl start grafana-server
  [root@localhost ~]# systemctl status grafana-server
  ● grafana-server.service - Grafana instance
     Loaded: loaded (/usr/lib/systemd/system/grafana-server.service; enabled; vendor preset: disabled)
     Active: active (running) since Thu 2018-10-18 10:41:48 CEST; 5s ago
       Docs: http://docs.grafana.org
   Main PID: 1757 (grafana-server)
     CGroup: /system.slice/grafana-server.service
             └─1757 /usr/sbin/grafana-server --config=/etc/grafana/grafana.ini --pidfile=/var/run/grafana/grafana-server.pid cfg:default.paths.logs=/var/log/grafana cfg:default.paths.data=/var/lib/grafana cfg:default.paths.plugins=/var...

   [root@localhost ~]#
To connect the Grafana application you should:
define the default login/password (line 151;154 in config file):
[root@localhost ~]# cat /etc/grafana/grafana.ini
148 #################################### Security ####################################
149 [security]
150 # default admin user, created on startup
151 admin_user = admin
152
153 # default admin password, can be changed before first start of grafana,  or in profile settings
154 admin_password = admin
155
restart grafana-server service:
systemctl restart grafana-server
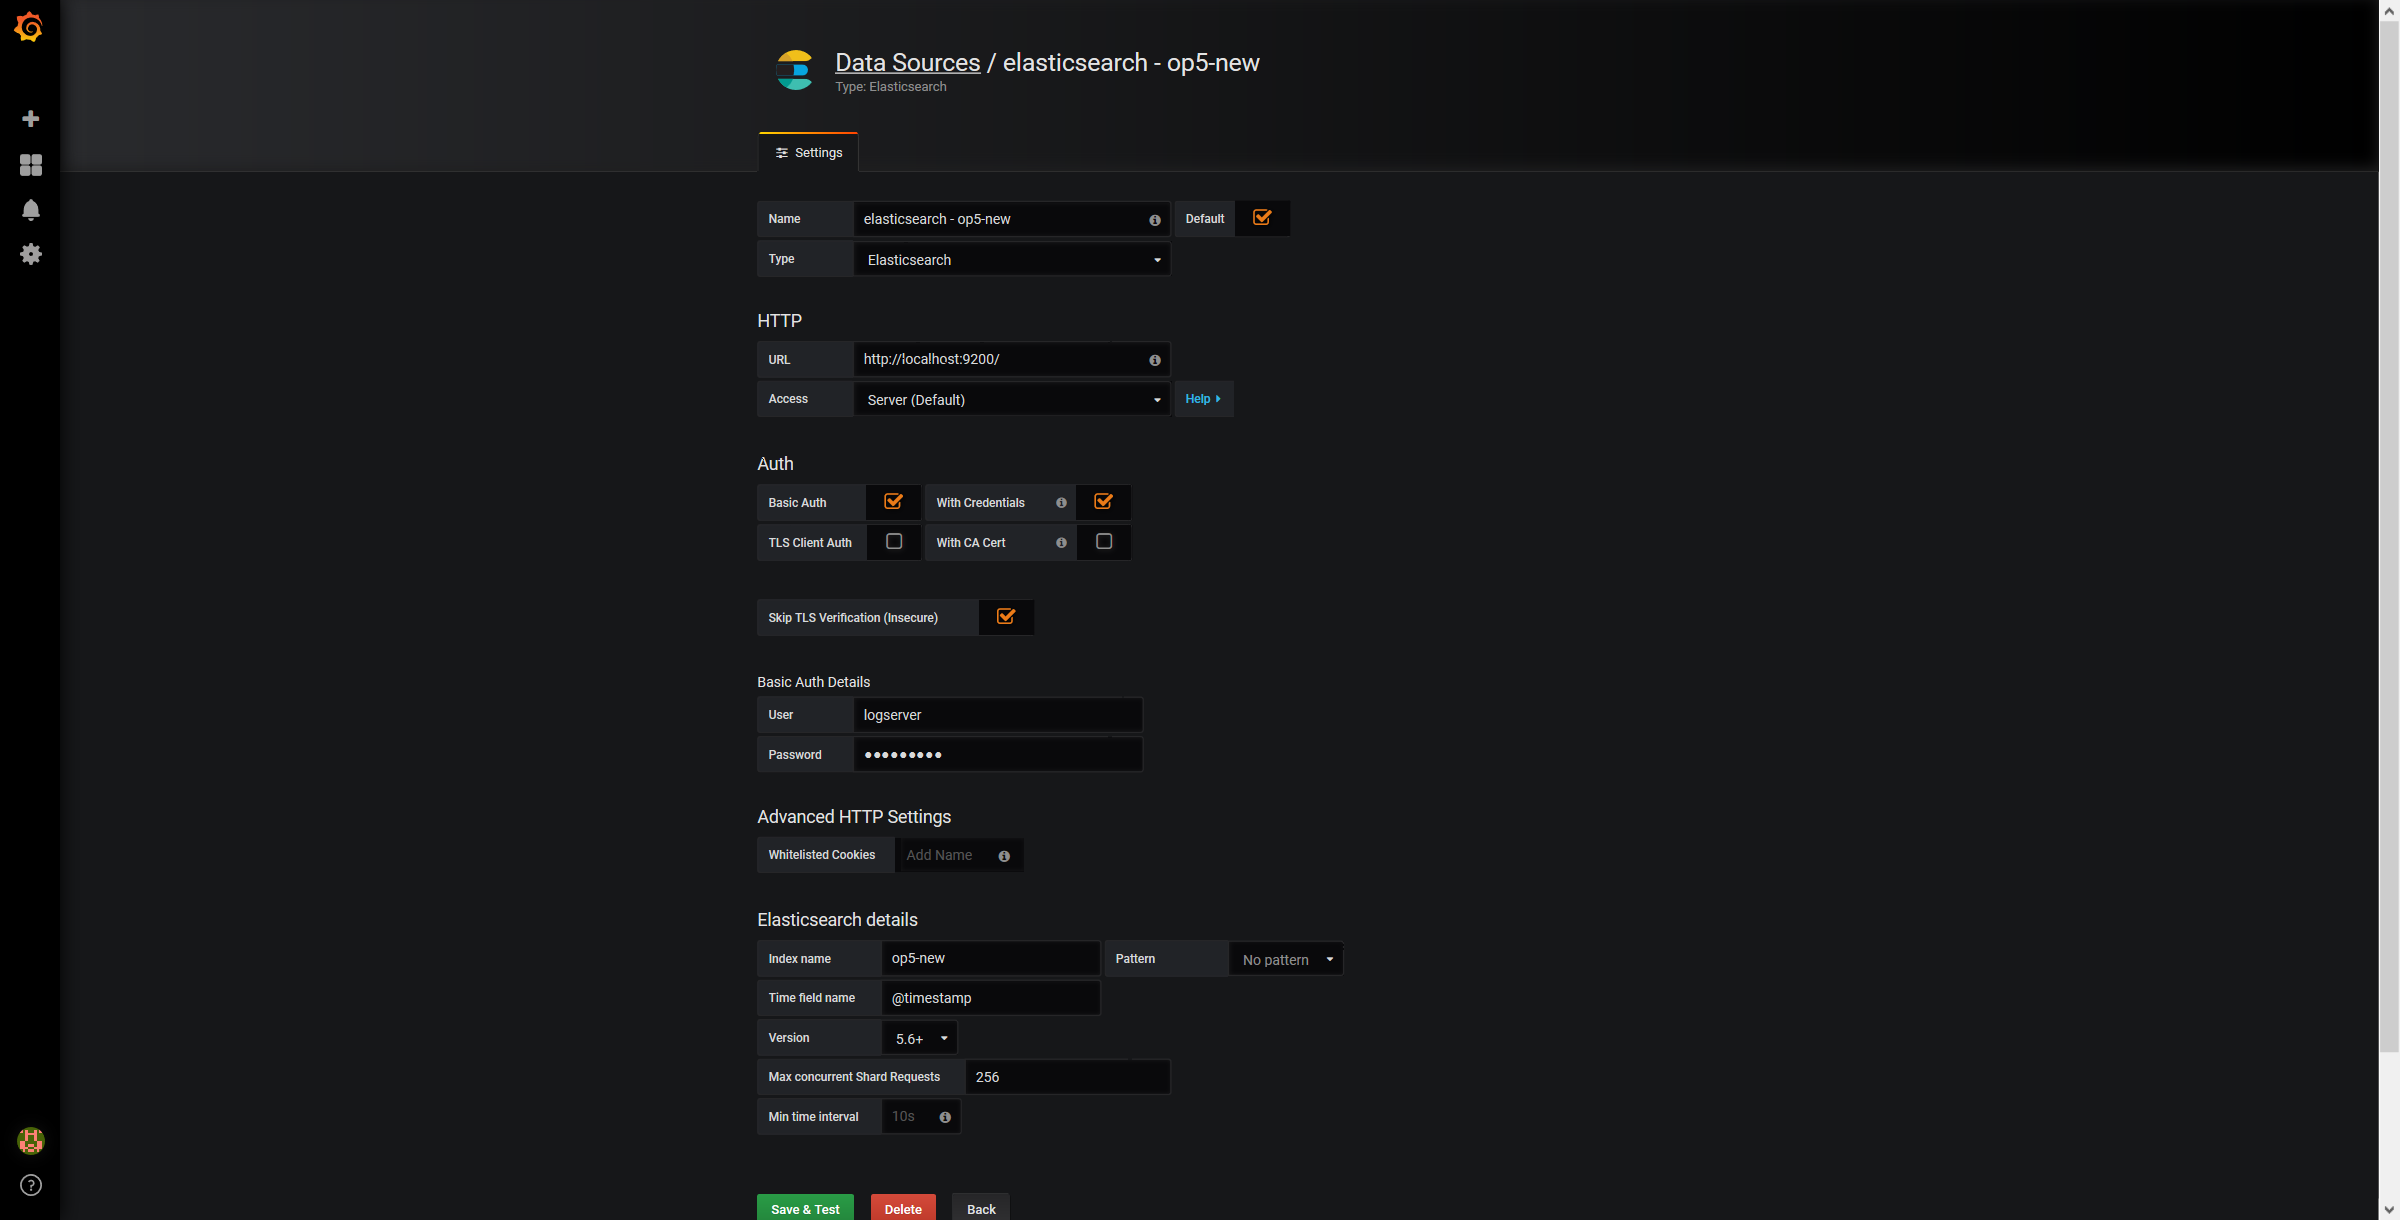
Login to Grafana user interface using web browser: http://ip:3000
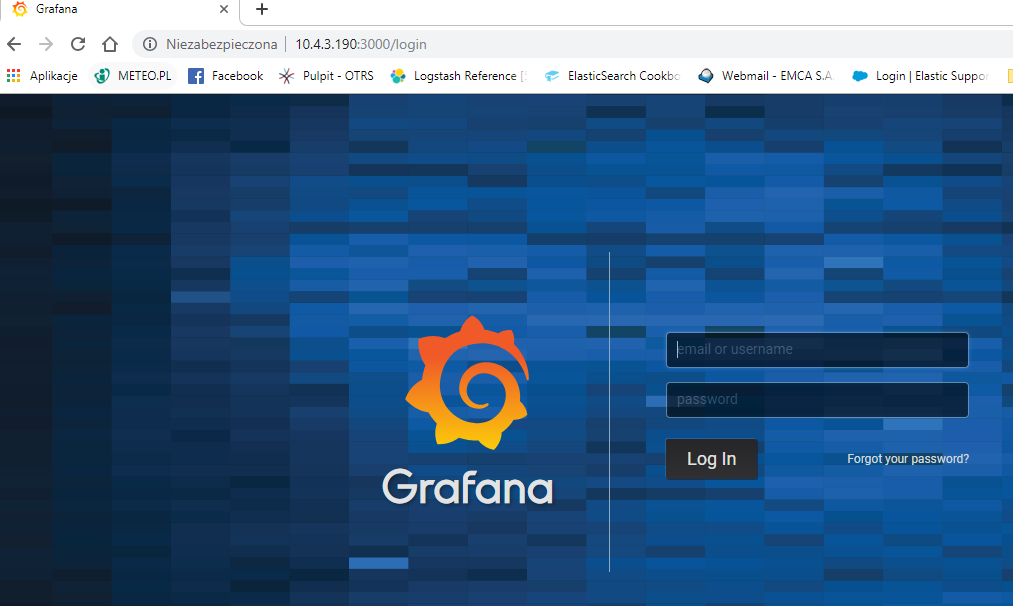
use login and password that you set in the config file.
Use below example to set conection to Elasticsearch server:
The Beats configuration
Kibana API
Reference link: https://www.elastic.co/guide/en/kibana/master/api.html
After installing any of beats package you can use ready to use dashboard related to this beat package. For instance dashboard and index pattern are available in /usr/share/filebeat/kibana/6/ directory on Linux.
Before uploading index-pattern or dashboard you have to authorize yourself:
Set up login/password/kibana_ip variables, e.g.:
 login=my_user
 password=my_password
 kibana_ip=10.4.11.243
Execute command which will save authorization cookie:
curl -c authorization.txt -XPOST -k "https://${kibana_ip}:5601/login" -d "username=${username}&password=${password}&version=6.2.3&location=https%3A%2F%2F${kibana_ip}%3A5601%2Flogin"
Upload index-pattern and dashboard to Kibana, e.g.:
curl -b authorization.txt -XPOST -k "https://${kibana_ip}:5601/api/kibana/dashboards/import" -H 'kbn-xsrf: true' -H 'Content-Type: application/json' -d@/usr/share/filebeat/kibana/6/index-pattern/filebeat.json
curl -b authorization.txt -XPOST -k "https://${kibana_ip}:5601/api/kibana/dashboards/import" -H 'kbn-xsrf: true' -H 'Content-Type: application/json' -d@/usr/share/filebeat/kibana/6/dashboard/Filebeat-mysql.json
When you want to upload beats index template to Ealsticsearch you have to recover it first (usually you do not send logs directly to Es rather than to Logstash first):
/usr/bin/filebeat export template --es.version 6.2.3 >> /path/to/beats_template.json
After that you can upload it as any other template (Access Es node with SSH):
curl -XPUT "localhost:9200/_template/ITRS Log Analyticsperfdata" -H'Content-Type: application/json' -d@beats_template.json
Wazuh integration
ITRS Log Analytics can integrate with the Wazuh, which is lightweight agent is designed to perform a number of tasks with the objective of detecting threats and, when necessary, trigger automatic responses. The agent core capabilities are:
- Log and events data collection
- File and registry keys integrity monitoring
- Inventory of running processes and installed applications
- Monitoring of open ports and network configuration
- Detection of rootkits or malware artifacts
- Configuration assessment and policy monitoring
- Execution of active responses
The Wazuh agents run on many different platforms, including Windows, Linux, Mac OS X, AIX, Solaris and HP-UX. They can be configured and managed from the Wazuh server.
Deploying Wazuh Server
https://documentation.wazuh.com/3.13/installation-guide/installing-wazuh-manager/linux/centos/index.html
Deploing Wazuh Agent
https://documentation.wazuh.com/3.13/installation-guide/installing-wazuh-agent/index.html
Filebeat configuration
2FA authorization with Google Auth Provider (example)
Software used (tested versions):
- NGiNX (1.16.1 - from CentOS base reposiory)
- oauth2_proxy (https://github.com/pusher/oauth2_proxy/releases - 4.0.0)
The NGiNX configuration:
Copy the ng_oauth2_proxy.conf to
/etc/nginx/conf.d/;server { listen 443 default ssl; server_name logserver.local; ssl_certificate /etc/kibana/ssl/logserver.org.crt; ssl_certificate_key /etc/kibana/ssl/logserver.org.key; ssl_session_cache builtin:1000 shared:SSL:10m; add_header Strict-Transport-Security max-age=2592000; location /oauth2/ { proxy_pass http://127.0.0.1:4180; proxy_set_header Host $host; proxy_set_header X-Real-IP $remote_addr; proxy_set_header X-Scheme $scheme; proxy_set_header X-Auth-Request-Redirect $request_uri; # or, if you are handling multiple domains: # proxy_set_header X-Auth-Request-Redirect $scheme://$host$request_uri; } location = /oauth2/auth { proxy_pass http://127.0.0.1:4180; proxy_set_header Host $host; proxy_set_header X-Real-IP $remote_addr; proxy_set_header X-Scheme $scheme; # nginx auth_request includes headers but not body proxy_set_header Content-Length ""; proxy_pass_request_body off; } location / { auth_request /oauth2/auth; error_page 401 = /oauth2/sign_in; # pass information via X-User and X-Email headers to backend, # requires running with --set-xauthrequest flag auth_request_set $user $upstream_http_x_auth_request_user; auth_request_set $email $upstream_http_x_auth_request_email; proxy_set_header X-User $user; proxy_set_header X-Email $email; # if you enabled --pass-access-token, this will pass the token to the backend auth_request_set $token $upstream_http_x_auth_request_access_token; proxy_set_header X-Access-Token $token; # if you enabled --cookie-refresh, this is needed for it to work with auth_request auth_request_set $auth_cookie $upstream_http_set_cookie; add_header Set-Cookie $auth_cookie; # When using the --set-authorization-header flag, some provider's cookies can exceed the 4kb # limit and so the OAuth2 Proxy splits these into multiple parts. # Nginx normally only copies the first `Set-Cookie` header from the auth_request to the response, # so if your cookies are larger than 4kb, you will need to extract additional cookies manually. auth_request_set $auth_cookie_name_upstream_1 $upstream_cookie_auth_cookie_name_1; # Extract the Cookie attributes from the first Set-Cookie header and append them # to the second part ($upstream_cookie_* variables only contain the raw cookie content) if ($auth_cookie ~* "(; .*)") { set $auth_cookie_name_0 $auth_cookie; set $auth_cookie_name_1 "auth_cookie__oauth2_proxy_1=$auth_cookie_name_upstream_1$1"; } # Send both Set-Cookie headers now if there was a second part if ($auth_cookie_name_upstream_1) { add_header Set-Cookie $auth_cookie_name_0; add_header Set-Cookie $auth_cookie_name_1; } proxy_pass https://127.0.0.1:5601; # or "root /path/to/site;" or "fastcgi_pass ..." etc } }
Set
ssl_certificateandssl_certificate_keypath in ng_oauth2_proxy.conf
When SSL is set using nginx proxy, Kibana can be started with http.
However, if it is to be run with encryption, you also need to change proxy_pass to the appropriate one.
The oauth2_proxy configuration:
Create a directory in which the program will be located and its configuration:
mkdir -p /usr/share/oauth2_proxy/
mkdir -p /etc/oauth2_proxy/
Copy files to directories:
cp oauth2_proxy /usr/share/oauth2_proxy/
cp oauth2_proxy.cfg /etc/oauth2_proxy/
Set directives according to OAuth configuration in Google Cloud project
cfg client_id = client_secret = # the following limits domains for authorization (* - all) email_domains = [ "*" ]Set the following according to the public hostname:
cookie_domain = "kibana-host.org"
In case og-in restrictions for a specific group defined on the Google side:
Create administrative account: https://developers.google.com/identity/protocols/OAuth2ServiceAccount ;
Get configuration to JSON file and copy Client ID;
On the dashboard of the Google Cloud select “APIs & Auth” -> “APIs”;
Click on “Admin SDK” and “Enable API”;
Follow the instruction at https://developers.google.com/admin-sdk/directory/v1/guides/delegation#delegate_domain-wide_authority_to_your_service_account and give the service account the following permissions:
  https://www.googleapis.com/auth/admin.directory.group.readonly
  https://www.googleapis.com/auth/admin.directory.user.readonly
Follow the instructions to grant access to the Admin API https://support.google.com/a/answer/60757
Create or select an existing administrative email in the Gmail domain to flag it
google-admin-emailCreate or select an existing group to flag it
google-groupCopy the previously downloaded JSON file to
/etc/oauth2_proxy/.In file oauth2_proxy set the appropriate path:
google_service_account_json =
Service start up
- Start the NGiNX service
- Start the oauth2_proxy service
/usr/share/oauth2_proxy/oauth2_proxy -config="/etc/oauth2_proxy/oauth2_proxy.cfg"
In the browser enter the address pointing to the server with the ITRS Log Analytics installation
Cerebro - Elasticsearch web admin tool
Software Requirements
Cerebro v0.8.4
wget 'https://github.com/lmenezes/cerebro/releases/download/v0.8.4/cerebro-0.8.4.tgz'Java 11+ [for basic-auth setup]
yum install java-11-openjdk-headless.x86_64
Java 1.8.0 [without authorization
yum install java-1.8.0-openjdk-headless
Firewall Configuration
firewall-cmd --permanent --add-port=5602/tcp
firewall-cmd --reload
Cerebro Configuration
Extract archive & move directory
tar -xvf cerebro-0.8.4.tgz -C /opt/
mv /opt/cerebro-0.8.4/ /opt/cerebro
Add Cerebro service user
useradd -M -d /opt/cerebro -s /sbin/nologin cerebro
Change Cerbero permissions
chown -R cerebro:cerebro /opt/cerebro && chmod -R 700 /opt/cerebro
Install Cerbero service (cerebro.service):
[Unit]
Description=Cerebro

[Service]
Type=simple
User=cerebro
Group=cerebro
ExecStart=/opt/cerebro/bin/cerebro "-Dconfig.file=/opt/cerebro/conf/application.conf"
Restart=always
WorkingDirectory=/opt/cerebro

[Install]
WantedBy=multi-user.target
cp cerebro.service /usr/lib/systemd/system/
systemctl daemon-reload
systemctl enable cerebro
Customize configuration file: /opt/cerebro/conf/application.conf
- Authentication
auth = {
  type: basic
   settings: {
      username = "user"
      password = "password"
    }
}
A list of known Elasticsearch hosts
hosts = [
  {
    host = "http://localhost:9200"
    name = "user"
    auth = {
      username = "username"
      password = "password"
    }
  }
]
If needed uses secure connection (SSL) with Elasticsearch, set the following section that contains path to certificate. And change the host definition from http to https:
play.ws.ssl {
  trustManager = {
    stores = [
      { type = "PEM", path = "/etc/elasticsearch/ssl/rootCA.crt" }
    ]
  }
}
play.ws.ssl.loose.acceptAnyCertificate=true
SSL access to cerebro
http = {
  port = "disabled"
}
https = {
  port = "5602"
}
#SSL access to cerebro - no self signed certificates
#play.server.https {
#  keyStore = {
#    path = "keystore.jks",
#    password = "SuperSecretKeystorePassword"
#  }
#}

#play.ws.ssl {
#  trustManager = {
#    stores = [
#      { type = "JKS", path = "truststore.jks", password = "SuperSecretTruststorePassword"  }
#    ]
#  }
#}
Start the service
systemctl start cerebro
goto: https://127.0.0.1:5602
Optional configuration
Register backup/snapshot repository for Elasticsearch
		curl -k -XPUT "https://127.0.0.1:9200/_snapshot/backup?pretty" -H 'Content-Type: application/json' -d'
		{
		  "type": "fs",
		  "settings": {
		    "location": "/var/lib/elasticsearch/backup/"
		  }
		}' -u user:password
Login using curl/kibana
curl -k -XPOST 'https://127.0.0.1:5602/auth/login' -H 'mimeType: application/x-www-form-urlencoded' -d 'user=user&password=passwrd' -c cookie.txt
curl -k -XGET 'https://127.0.0.1:5602' -b cookie.txt
Elasticdump
Elasticdump is a tool for moving and saving indices.
Location
/usr/share/kibana/elasticdump/elasticdump
Examples of use
Copy an index from production to staging with analyzer and mapping
elasticdump \
  --input=http://production.es.com:9200/my_index \
  --output=http://staging.es.com:9200/my_index \
  --type=analyzer
elasticdump \
  --input=http://production.es.com:9200/my_index \
  --output=http://staging.es.com:9200/my_index \
  --type=mapping
elasticdump \
  --input=http://production.es.com:9200/my_index \
  --output=http://staging.es.com:9200/my_index \
  --type=data
Backup index data to a file:
elasticdump \
  --input=http://production.es.com:9200/my_index \
  --output=/data/my_index_mapping.json \
  --type=mapping
elasticdump \
  --input=http://production.es.com:9200/my_index \
  --output=/data/my_index.json \
  --type=data
Backup and index to a gzip using stdout
elasticdump \
  --input=http://production.es.com:9200/my_index \
  --output=$ \
  | gzip > /data/my_index.json.gz
Backup the results of a query to a file
elasticdump \
  --input=http://production.es.com:9200/my_index \
  --output=query.json \
  --searchBody="{\"query\":{\"term\":{\"username\": \"admin\"}}}"
Copy a single shard data
elasticdump \
  --input=http://es.com:9200/api \
  --output=http://es.com:9200/api2 \
  --params="{\"preference\":\"_shards:0\"}"
Backup aliases to a file
elasticdump \
  --input=http://es.com:9200/index-name/alias-filter \
  --output=alias.json \
  --type=alias
Import aliases into ES
elasticdump \
  --input=./alias.json \
  --output=http://es.com:9200 \
  --type=alias
Backup templates to a file
elasticdump \
  --input=http://es.com:9200/template-filter \
  --output=templates.json \
  --type=template
Import templates into ES
elasticdump \
  --input=./templates.json \
  --output=http://es.com:9200 \
  --type=template
Split files into multiple parts
elasticdump \
  --input=http://production.es.com:9200/my_index \
  --output=/data/my_index.json \
  --fileSize=10mb
Import data from S3 into ES (using s3urls)
elasticdump \
  --s3AccessKeyId "${access_key_id}" \
  --s3SecretAccessKey "${access_key_secret}" \
  --input "s3://${bucket_name}/${file_name}.json" \
  --output=http://production.es.com:9200/my_index
Export ES data to S3 (using s3urls)
elasticdump \
  --s3AccessKeyId "${access_key_id}" \
  --s3SecretAccessKey "${access_key_secret}" \
  --input=http://production.es.com:9200/my_index \
  --output "s3://${bucket_name}/${file_name}.json"
Import data from MINIO (s3 compatible) into ES (using s3urls)
elasticdump \
  --s3AccessKeyId "${access_key_id}" \
  --s3SecretAccessKey "${access_key_secret}" \
  --input "s3://${bucket_name}/${file_name}.json" \
  --output=http://production.es.com:9200/my_index
  --s3ForcePathStyle true
  --s3Endpoint https://production.minio.co
Export ES data to MINIO (s3 compatible) (using s3urls)
elasticdump \
  --s3AccessKeyId "${access_key_id}" \
  --s3SecretAccessKey "${access_key_secret}" \
  --input=http://production.es.com:9200/my_index \
  --output "s3://${bucket_name}/${file_name}.json"
  --s3ForcePathStyle true
  --s3Endpoint https://production.minio.co
Import data from CSV file into ES (using csvurls)
elasticdump \

  # csv:// prefix must be included to allow parsing of csv files

  # --input "csv://${file_path}.csv" \

  --input "csv:///data/cars.csv"
  --output=http://production.es.com:9200/my_index \
  --csvSkipRows 1    # used to skip parsed rows (this does not include the headers row)
  --csvDelimiter ";" # default csvDelimiter is ','
Copy a single index from a elasticsearch:
elasticdump \
  --input=http://es.com:9200/api/search \
  --input-index=my_index \
  --output=http://es.com:9200/api/search \
  --output-index=my_index \
  --type=mapping
Copy a single type:
elasticdump \
  --input=http://es.com:9200/api/search \
  --input-index=my_index/my_type \
  --output=http://es.com:9200/api/search \
  --output-index=my_index \
  --type=mapping
Usage
elasticdump --input SOURCE --output DESTINATION [OPTIONS]
All parameters
--input
Source location (required)
--input-index
Source index and type
(default: all, example: index/type)
--output
Destination location (required)
--output-index
Destination index and type
(default: all, example: index/type)
--overwrite
Overwrite output file if it exists
(default: false)
--limit
How many objects to move in batch per operation
limit is approximate for file streams
(default: 100)
--size
How many objects to retrieve
(default: -1 -> no limit)
--concurrency
The maximum number of requests the can be made concurrently to a specified transport.
(default: 1)
--concurrencyInterval
The length of time in milliseconds in which up to <intervalCap> requests can be made
before the interval request count resets. Must be finite.
(default: 5000)
--intervalCap
The maximum number of transport requests that can be made within a given <concurrencyInterval>.
(default: 5)
--carryoverConcurrencyCount
If true, any incomplete requests from a <concurrencyInterval> will be carried over to
the next interval, effectively reducing the number of new requests that can be created
in that next interval. If false, up to <intervalCap> requests can be created in the
next interval regardless of the number of incomplete requests from the previous interval.
(default: true)
--throttleInterval
Delay in milliseconds between getting data from an inputTransport and sending it to an
outputTransport.
(default: 1)
--debug
Display the elasticsearch commands being used
(default: false)
--quiet
Suppress all messages except for errors
(default: false)
--type
What are we exporting?
(default: data, options: [settings, analyzer, data, mapping, alias, template, component_template, index_template])
--filterSystemTemplates
Whether to remove metrics-*-* and logs-*-* system templates
(default: true])
--templateRegex
Regex used to filter templates before passing to the output transport
(default: ((metrics|logs|\\..+)(-.+)?)
--delete
Delete documents one-by-one from the input as they are
moved. Will not delete the source index
(default: false)
--searchBody
Preform a partial extract based on search results
when ES is the input, default values are
if ES > 5
`'{"query": { "match_all": {} }, "stored_fields": ["*"], "_source": true }'`
else
`'{"query": { "match_all": {} }, "fields": ["*"], "_source": true }'`
--searchWithTemplate
Enable to use Search Template when using --searchBody
If using Search Template then searchBody has to consist of "id" field and "params" objects
If "size" field is defined within Search Template, it will be overridden by --size parameter
See https://www.elastic.co/guide/en/elasticsearch/reference/current/search-template.html for
further information
(default: false)
--headers
Add custom headers to Elastisearch requests (helpful when
your Elasticsearch instance sits behind a proxy)
(default: '{"User-Agent": "elasticdump"}')
--params
Add custom parameters to Elastisearch requests uri. Helpful when you for example
want to use elasticsearch preference
(default: null)
--sourceOnly
Output only the json contained within the document _source
Normal: {"_index":"","_type":"","_id":"", "_source":{SOURCE}}
sourceOnly: {SOURCE}
(default: false)
--ignore-errors
Will continue the read/write loop on write error
(default: false)
--scrollId
The last scroll Id returned from elasticsearch.
This will allow dumps to be resumed used the last scroll Id &
`scrollTime` has not expired.
--scrollTime
Time the nodes will hold the requested search in order.
(default: 10m)
--maxSockets
How many simultaneous HTTP requests can we process make?
(default:
5 [node <= v0.10.x] /
Infinity [node >= v0.11.x] )
--timeout
Integer containing the number of milliseconds to wait for
a request to respond before aborting the request. Passed
directly to the request library. Mostly used when you don't
care too much if you lose some data when importing
but rather have speed.
--offset
Integer containing the number of rows you wish to skip
ahead from the input transport. When importing a large
index, things can go wrong, be it connectivity, crashes,
someone forgetting to `screen`, etc. This allows you
to start the dump again from the last known line written
(as logged by the `offset` in the output). Please be
advised that since no sorting is specified when the
dump is initially created, there's no real way to
guarantee that the skipped rows have already been
written/parsed. This is more of an option for when
you want to get most data as possible in the index
without concern for losing some rows in the process,
similar to the `timeout` option.
(default: 0)
--noRefresh
Disable input index refresh.
Positive:
1. Much increase index speed
are requirements
Negative:
1. Recently added data may not be indexed
with big data indexing,
where speed and system health in a higher priority
than recently added data.
--inputTransport
Provide a custom js file to use as the input transport
--outputTransport
Provide a custom js file to use as the output transport
--toLog
When using a custom outputTransport, should log lines
be appended to the output stream?
(default: true, except for `$`)
--transform
A method/function which can be called to modify documents
before writing to a destination. A global variable 'doc'
is available.
Example script for computing a new field 'f2' as doubled
value of field 'f1':
doc._source["f2"] = doc._source.f1 * 2;
May be used multiple times.
Additionally, transform may be performed by a module. See [Module Transform](#module-transform) below.
--awsChain
Use [standard](https://aws.amazon.com/blogs/security/a-new-and-standardized-way-to-manage-credentials-in-the-aws-sdks/) location and ordering for resolving credentials including environment variables, config files, EC2 and ECS metadata locations
_Recommended option for use with AWS_
Use [standard](https://aws.amazon.com/blogs/security/a-new-and-standardized-way-to-manage-credentials-in-the-aws-sdks/)
location and ordering for resolving credentials including environment variables,
config files, EC2 and ECS metadata locations _Recommended option for use with AWS_
--awsAccessKeyId
--awsSecretAccessKey
When using Amazon Elasticsearch Service protected by
AWS Identity and Access Management (IAM), provide
your Access Key ID and Secret Access Key.
--sessionToken can also be optionally provided if using temporary credentials
--awsIniFileProfile
Alternative to --awsAccessKeyId and --awsSecretAccessKey,
loads credentials from a specified profile in aws ini file.
For greater flexibility, consider using --awsChain
and setting AWS_PROFILE and AWS_CONFIG_FILE
environment variables to override defaults if needed
--awsIniFileName
Override the default aws ini file name when using --awsIniFileProfile
Filename is relative to ~/.aws/
(default: config)
--awsService
Sets the AWS service that the signature will be generated for
(default: calculated from hostname or host)
--awsRegion
Sets the AWS region that the signature will be generated for
(default: calculated from hostname or host)
--awsUrlRegex
Regular expression that defined valied AWS urls that should be signed
(default: ^https?:\\.*.amazonaws.com.*$)
--support-big-int
Support big integer numbers
--big-int-fields
Sepcifies a comma-seperated list of fields that should be checked for big-int support
(default '')
--retryAttempts
Integer indicating the number of times a request should be automatically re-attempted before failing
when a connection fails with one of the following errors `ECONNRESET`, `ENOTFOUND`, `ESOCKETTIMEDOUT`,
ETIMEDOUT`, `ECONNREFUSED`, `EHOSTUNREACH`, `EPIPE`, `EAI_AGAIN`
(default: 0)
--retryDelay
Integer indicating the back-off/break period between retry attempts (milliseconds)
(default : 5000)
--parseExtraFields
Comma-separated list of meta-fields to be parsed
--maxRows
supports file splitting. Files are split by the number of rows specified
--fileSize
supports file splitting. This value must be a string supported by the **bytes** module.
The following abbreviations must be used to signify size in terms of units
b for bytes
kb for kilobytes
mb for megabytes
gb for gigabytes
tb for terabytes
e.g. 10mb / 1gb / 1tb
Partitioning helps to alleviate overflow/out of memory exceptions by efficiently segmenting files
into smaller chunks that then be merged if needs be.
--fsCompress
gzip data before sending output to file.
On import the command is used to inflate a gzipped file
--s3AccessKeyId
AWS access key ID
--s3SecretAccessKey
AWS secret access key
--s3Region
AWS region
--s3Endpoint
AWS endpoint can be used for AWS compatible backends such as
OpenStack Swift and OpenStack Ceph
--s3SSLEnabled
Use SSL to connect to AWS [default true]
--s3ForcePathStyle Force path style URLs for S3 objects [default false]
--s3Compress
gzip data before sending to s3
--s3ServerSideEncryption
Enables encrypted uploads
--s3SSEKMSKeyId
KMS Id to be used with aws:kms uploads
--s3ACL
S3 ACL: private | public-read | public-read-write | authenticated-read | aws-exec-read |
bucket-owner-read | bucket-owner-full-control [default private]
--retryDelayBase
The base number of milliseconds to use in the exponential backoff for operation retries. (s3)
--customBackoff
Activate custom customBackoff function. (s3)
--tlsAuth
Enable TLS X509 client authentication
--cert, --input-cert, --output-cert
Client certificate file. Use --cert if source and destination are identical.
Otherwise, use the one prefixed with --input or --output as needed.
--key, --input-key, --output-key
Private key file. Use --key if source and destination are identical.
Otherwise, use the one prefixed with --input or --output as needed.
--pass, --input-pass, --output-pass
Pass phrase for the private key. Use --pass if source and destination are identical.
Otherwise, use the one prefixed with --input or --output as needed.
--ca, --input-ca, --output-ca
CA certificate. Use --ca if source and destination are identical.
Otherwise, use the one prefixed with --input or --output as needed.
--inputSocksProxy, --outputSocksProxy
Socks5 host address
--inputSocksPort, --outputSocksPort
Socks5 host port
--handleVersion
Tells elastisearch transport to handle the `_version` field if present in the dataset
(default : false)
--versionType
Elasticsearch versioning types. Should be `internal`, `external`, `external_gte`, `force`.
NB : Type validation is handled by the bulk endpoint and not by elasticsearch-dump
--csvDelimiter
The delimiter that will separate columns.
(default : ',')
--csvFirstRowAsHeaders
If set to true the first row will be treated as the headers.
(default : true)
--csvRenameHeaders
If you want the first line of the file to be removed and replaced by the one provided in the `csvCustomHeaders` option
(default : true)
--csvCustomHeaders A comma-seperated listed of values that will be used as headers for your data. This param must
be used in conjunction with `csvRenameHeaders`
(default : null)
--csvWriteHeaders Determines if headers should be written to the csv file.
(default : true)
--csvIgnoreEmpty
Set to true to ignore empty rows.
(default : false)
--csvSkipLines
If number is > 0 the specified number of lines will be skipped.
(default : 0)
--csvSkipRows
If number is > 0 then the specified number of parsed rows will be skipped
NB: (If the first row is treated as headers, they aren't a part of the count)
(default : 0)
--csvMaxRows
If number is > 0 then only the specified number of rows will be parsed.(e.g. 100 would return the first 100 rows of data)
(default : 0)
--csvTrim
Set to true to trim all white space from columns.
(default : false)
--csvRTrim
Set to true to right trim all columns.
(default : false)
--csvLTrim
Set to true to left trim all columns.
(default : false)
--csvHandleNestedData
Set to true to handle nested JSON/CSV data.
NB : This is a very optioninated implementaton !
(default : false)
--csvIdColumn
Name of the column to extract the record identifier (id) from
When exporting to CSV this column can be used to override the default id (@id) column name
(default : null)
--csvIndexColumn
Name of the column to extract the record index from
When exporting to CSV this column can be used to override the default index (@index) column name
(default : null)
--csvTypeColumn
Name of the column to extract the record type from
When exporting to CSV this column can be used to override the default type (@type) column name
(default : null)
--help
This page
Elasticsearch’s Scroll API
Elasticsearch provides a scroll API to fetch all documents of an index starting from (and keeping) a consistent snapshot in time, which we use under the hood. This method is safe to use for large exports since it will maintain the result set in cache for the given period of time.
NOTE: only works for –output
Bypassing self-sign certificate errors
Set the environment NODE_TLS_REJECT_UNAUTHORIZED=0 before running elasticdump
An alternative method of passing environment variables before execution
NB : This only works with linux shells
NODE_TLS_REJECT_UNAUTHORIZED=0 elasticdump –input=”https://localhost:9200” –output myfile
Curator - Elasticsearch index management tool
Curator is a tool that allows you to perform index management tasks, such as:
- Close Indices
- Delete Indices
- Delete Snapshots
- Forcemerge segments
- Changing Index Settings
- Open Indices
- Reindex data
And other.
Curator installation
Curator is delivered with the client node installer.
Curator configuration
Create directory for configuration:
mkdir /etc/curator
Create directory for Curator logs file:
mkdir /var/log/curator
Running Curator
The curator executable is located in the directory:
/usr/share/kibana/curator/bin/curator
Curator requires two parameters:
- config - path to configuration file for Curator
- path to action file for Curator
Example running command:
/usr/share/kibana/curator/bin/curator --config /etc/curator/curator.conf /etc/curator/close_indices.yml
Sample configuration file
Remember, leave a key empty if there is no value. None will be a string, not a Python “NoneType”
client:
  hosts:
    - 127.0.0.1
  port: 9200
#  url_prefix:
#  use_ssl: False
#  certificate:
  client_cert:
  client_key:
  ssl_no_validate: False
  http_auth: $user:$passowrd
  timeout: 30
  master_only: True

logging:
  loglevel: INFO
  logfile: /var/log/curator/curator.log
  logformat: default
  blacklist: ['elasticsearch', 'urllib3']
Sample action file
close indices
actions:
  1:
    action: close
    description: >-
      Close indices older than 30 days (based on index name), for logstash-
      prefixed indices.
    options:
      delete_aliases: False
      timeout_override:
      continue_if_exception: False
      disable_action: True
    filters:
    - filtertype: pattern
      kind: prefix
      value: logstash-
      exclude:
    - filtertype: age
      source: name
      direction: older
      timestring: '%Y.%m.%d'
      unit: days
      unit_count: 30
      exclude:
delete indices
actions:
  1:
    action: delete_indices
    description: >-
      Delete indices older than 45 days (based on index name), for logstash-
      prefixed indices. Ignore the error if the filter does not result in an
      actionable list of indices (ignore_empty_list) and exit cleanly.
    options:
      ignore_empty_list: True
      timeout_override:
      continue_if_exception: False
      disable_action: True
    filters:
    - filtertype: pattern
      kind: prefix
      value: logstash-
      exclude:
    - filtertype: age
      source: name
      direction: older
      timestring: '%Y.%m.%d'
      unit: days
      unit_count: 45
      exclude:
forcemerge segments
actions:
  1:
    action: forcemerge
    description: >-
      forceMerge logstash- prefixed indices older than 2 days (based on index
      creation_date) to 2 segments per shard.  Delay 120 seconds between each
      forceMerge operation to allow the cluster to quiesce.
      This action will ignore indices already forceMerged to the same or fewer
      number of segments per shard, so the 'forcemerged' filter is unneeded.
    options:
      max_num_segments: 2
      delay: 120
      timeout_override:
      continue_if_exception: False
      disable_action: True
    filters:
    - filtertype: pattern
      kind: prefix
      value: logstash-
      exclude:
    - filtertype: age
      source: creation_date
      direction: older
      unit: days
      unit_count: 2
      exclude:
open indices
actions:
  1:
    action: open
    description: >-
      Open indices older than 30 days but younger than 60 days (based on index
      name), for logstash- prefixed indices.
    options:
      timeout_override:
      continue_if_exception: False
      disable_action: True
    filters:
    - filtertype: pattern
      kind: prefix
      value: logstash-
      exclude:
    - filtertype: age
      source: name
      direction: older
      timestring: '%Y.%m.%d'
      unit: days
      unit_count: 30
      exclude:
    - filtertype: age
      source: name
      direction: younger
      timestring: '%Y.%m.%d'
      unit: days
      unit_count: 60
      exclude:
replica reduce
actions:
  1:
    action: replicas
    description: >-
      Reduce the replica count to 0 for logstash- prefixed indices older than
      10 days (based on index creation_date)
    options:
      count: 0
      wait_for_completion: False
      timeout_override:
      continue_if_exception: False
      disable_action: True
    filters:
    - filtertype: pattern
      kind: prefix
      value: logstash-
      exclude:
    - filtertype: age
      source: creation_date
      direction: older
      unit: days
      unit_count: 10
      exclude:
Cross-cluster Search
Cross-cluster search lets you run a single search request against one or more remote clusters. For example, you can use a cross-cluster search to filter and analyze log data stored on clusters in different data centers.
Configuration
Use
_clusterAPI to add least one remote cluster:curl -u user:password -X PUT "localhost:9200/_cluster/settings?pretty" -H 'Content-Type: application/json' -d' { "persistent": { "cluster": { "remote": { "cluster_one": { "seeds": [ "192.168.0.1:9300" ] }, "cluster_two": { "seeds": [ "192.168.0.2:9300" ] } } } } }'
To search data in index
twitterlocated on thecluster_oneuse following command:curl -u user:password -X GET "localhost:9200/cluster_one:twitter/_search?pretty" -H 'Content-Type: application/json' -d' { "query": { "match": { "user": "kimchy" } } }'
To search data in index
twitterlocated on multiple clusters, use following command:curl -u user:password -X GET "localhost:9200/twitter,cluster_one:twitter,cluster_two:twitter/_search?pretty" -H 'Content-Type: application/json' -d' { "query": { "match": { "user": "kimchy" } } }'
Configure index pattern in Kibana GUI to discover data from multiple clusters:
cluster_one:logstash-*,cluster_two:logstash-*

Security
Cross-cluster search uses the Elasticsearch transport layer (default 9300/tcp port) to exchange data. To secure the transmission, encryption must be enabled for the transport layer.
Configuration is in the /etc/elasticsearch/elastisearch.yml file:
# Transport layer encryption
logserverguard.ssl.transport.enabled: true
logserverguard.ssl.transport.pemcert_filepath: "/etc/elasticsearch/ssl/certificate.crt"
logserverguard.ssl.transport.pemkey_filepath: "/etc/elasticsearch/ssl/certificate.key"
logserverguard.ssl.transport.pemkey_password: ""
logserverguard.ssl.transport.pemtrustedcas_filepath: "/etc/elasticsearch/ssl/rootCA.crt"

logserverguard.ssl.transport.enforce_hostname_verification: false
logserverguard.ssl.transport.resolve_hostname: false
Encryption must be enabled on each cluster.
Sync/Copy
The Sync/Copy module allows you to synchronize or copy data between two Elasticsearch clusters. You can copy or synchronize selected indexes or indicate index pattern.
Configuration
Before starting Sync/Copy, complete the source and target cluster data in the Profile and Create profiletab:
- Protocol - http or https;
- Host - IP address ingest node;
- Port - communication port (default 9200);
- Username - username that has permission to get data and save data to the cluster;
- Password - password of the above user
- Cluster name

You can view or delete the profile in the Profile List tab.
Synchronize data
To perform data synchronization, follow the instructions:
- go to the
Synctab; - select
Source Profile - select
Destination Profile - enter the index pattern name in
Index pattern to sync - or use switch
Toggle to select between Index pattern or nameand enter indices name. - to create synchronization task, press
Submitbutton

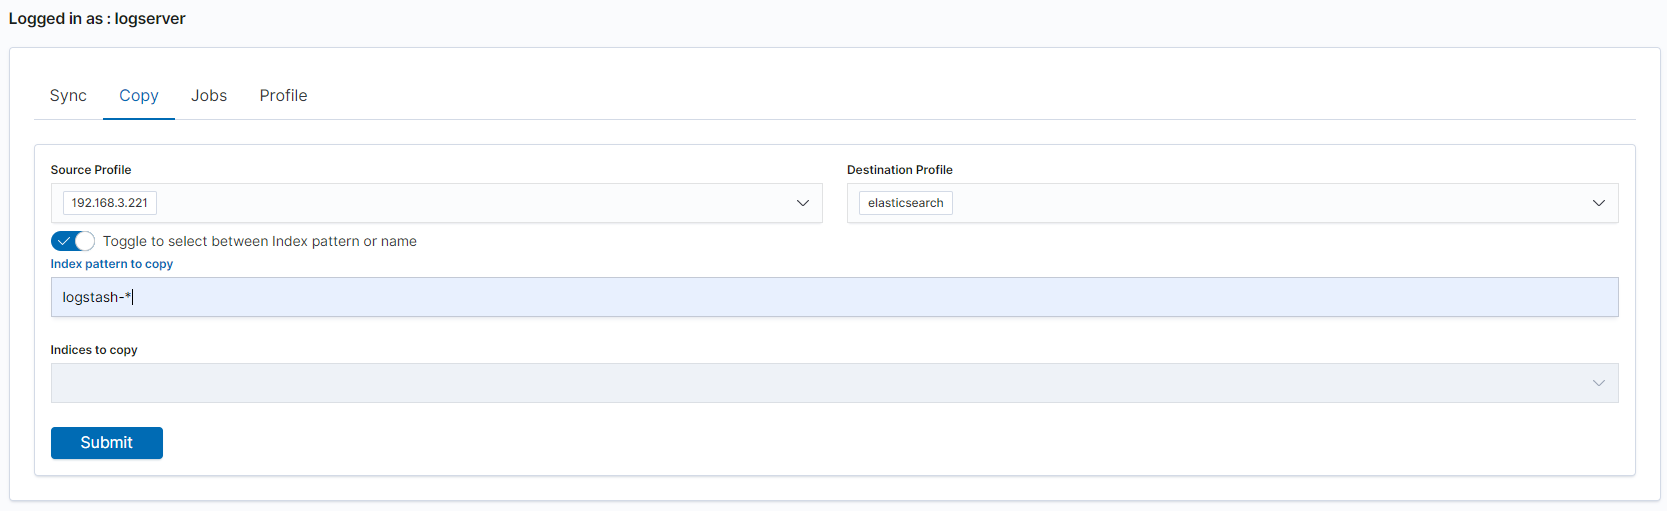
Copy data
To perform data copy, follow the instructions:
- go to the
Copytab; - select
Source Profile - select
Destination Profile - enter the index pattern name in
Index pattern to sync - or use switch
Toggle to select between Index pattern or nameand enter indices name. - to start copying data press the
Submitbutton
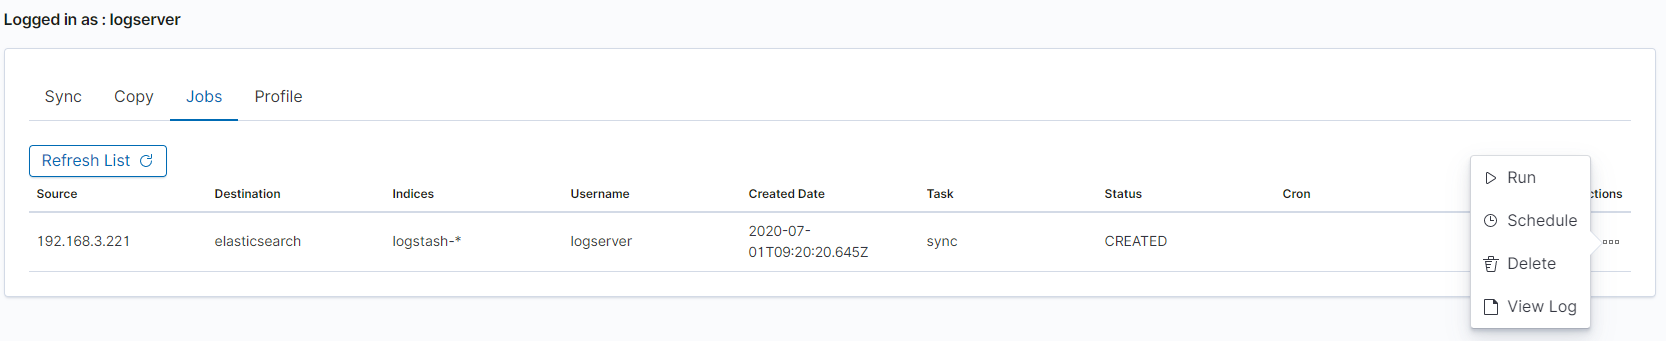
Running Sync/Copy
Prepared Copy/Sync tasks can be run on demand or according to a set schedule.
To do this, go to the Jobs tab. With each task you will find the Action button that allows:
- running the task;
- scheduling task in Cron format;
- deleting task;
- download task logs.
XLSX Import
The XLSX Import module allow to import your xlsx and csv file to indices.
Importing steps
Go to XLSX Import module and select your file and sheet:
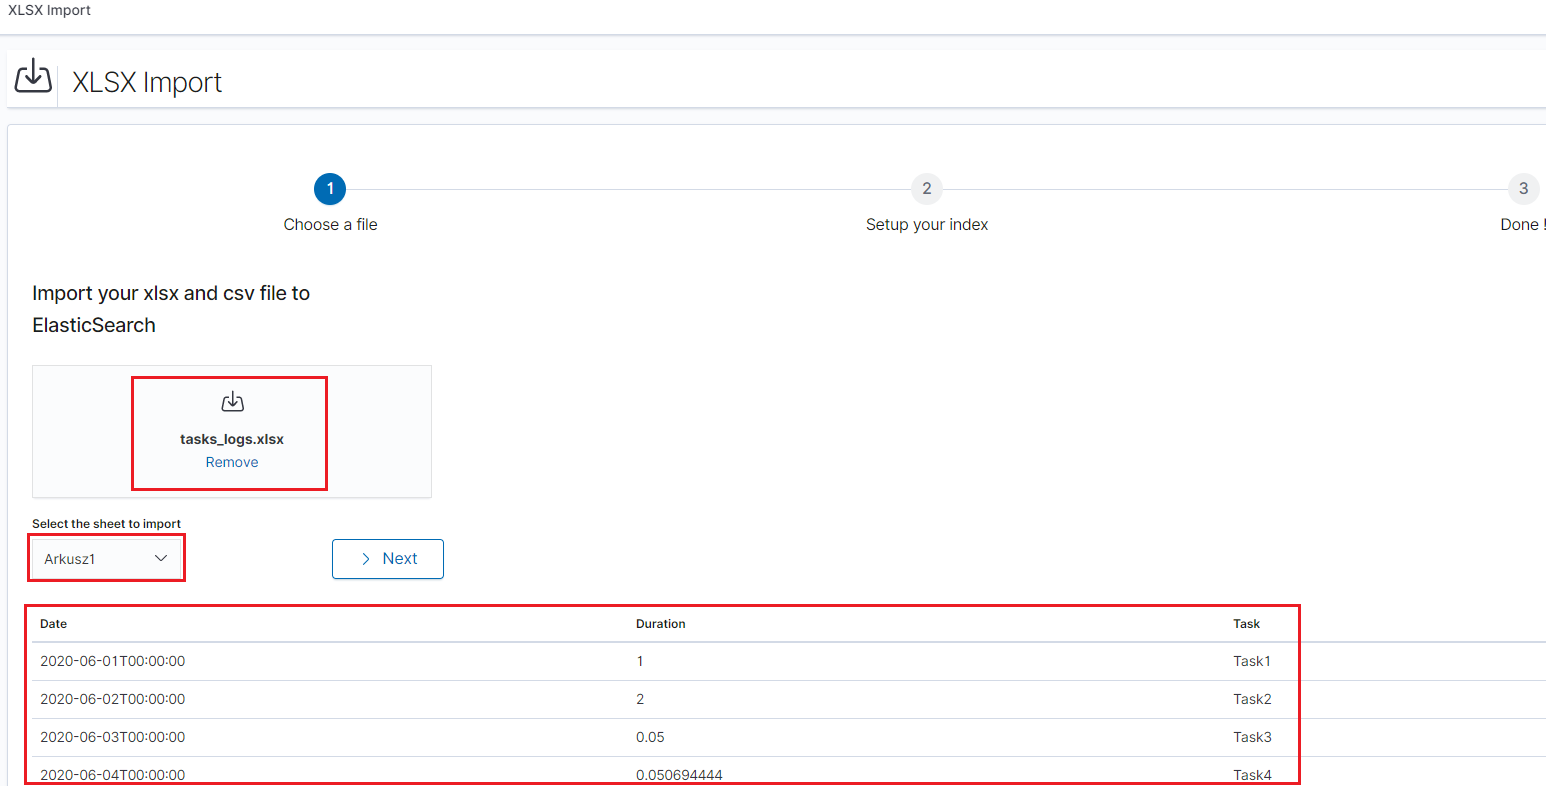
After the data has been successfully loaded, you will see a preview of your data at the bottom of the window.
Press
Nextbutton.In the next step, enter the index name in the
Index namefield, you can also change the pattern for the document ID and select the columns that the import will skip.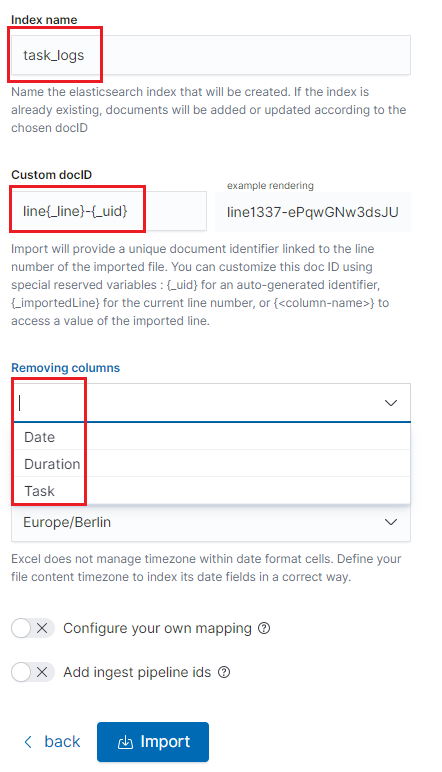
Select the
Configure your own mappingfor every field. You can choose the type and apply more options with the advanced JSON. The list of parameters can be found here, https://www.elastic.co/guide/en/elasticsearch/reference/7.x/mapping-params.htmlAfter the import configuration is complete, select the
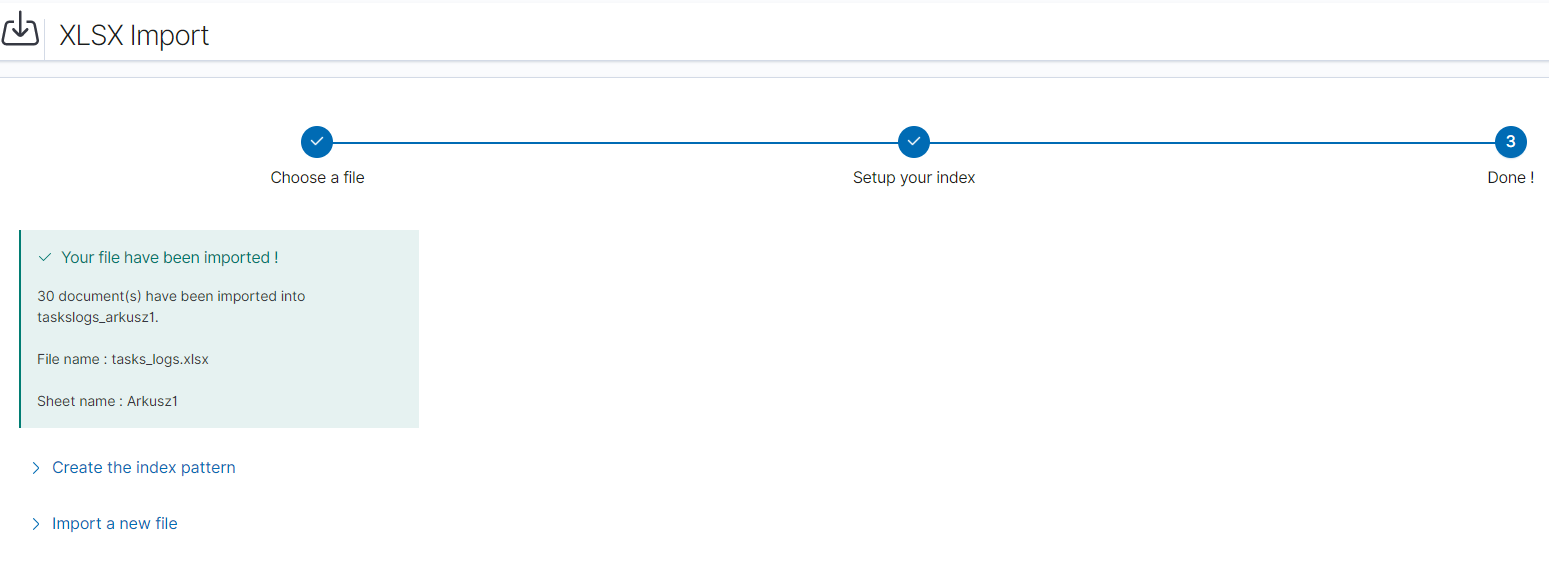
Importbutton to start the import process.After the import process is completed, a summary will be displayed. Now you can create a new index pattern to view your data in the Discovery module.
Logtrail
LogTrail module allow to view, analyze, search and tail log events from multiple indices in realtime. Main features of this module are:
- View, analyze and search log events from a centralized interface
- Clean & simple devops friendly interface
- Live tail
- Filter aggregated logs by hosts and program
- Quickly seek to logs based on time
- Supports highlighting of search matches
- Supports multiple Elasticsearch index patterns each with different schemas
- Can be extended by adding additional fields to log event
- Color coding of messages based on field values
Default Logtrail configuration, keeps track of event logs for Elasticsearch, Logstash, Kibana and Alert processes. The module allows you to track events from any index stored in Elasticsearch.
Configuration
The LogTrail module uses the Logstash pipeline to retrieve data from any of the event log files and save its contents to the Elasticsearch index.
Logstash configuration
Example for the file /var/log/messages
Add the Logstash configuration file in the correct pipline (default is “logtrail”):
vi /etc/logstash/conf.d/logtrail/messages.conf
input {
    file {
        path => "/var/log/messages"
        start_position => beginning
        tags => "logtrail_messages"
    }
}
filter {
        if "logtrail_messages" in [tags] {
                grok {
                        match => {
                                #"message" => "%{SYSLOGTIMESTAMP:syslog_timestamp} %{SYSLOGHOST:hostname} %{DATA:program}(?:\[%{POSINT:pid}\])?: %{GREEDYDATA:syslog_message}"
# If syslog is format is "<%PRI%><%syslogfacility%>%TIMESTAMP% %HOSTNAME% %syslogtag%%msg:::sp-if-no-1st-sp%%msg:::drop-last-lf%\n"
                                "message" => "<?%{NONNEGINT:priority}><%{NONNEGINT:facility}>%{SYSLOGTIMESTAMP:syslog_timestamp} %{SYSLOGHOST:hostname} %{DATA:program}(?:\[%{POSINT:pid}\])?: %{GREEDYDATA:syslog_message}"
                                }
                        }
                date {
                        match => [ "syslog_timestamp", "MMM  d HH:mm:ss", "MMM dd HH:mm:ss" ]
                }
                ruby {
                        code =>  "event.set('level',event.get('priority').to_i - ( event.get('facility').to_i * 8 ))"
                }
        }
}
output {
    if "logtrail_messages" in [tags] {
        elasticsearch {
            hosts => "http://localhost:9200"
            index => "logtrail-messages-%{+YYYY.MM}"
            user => "logstash"
            password => "logstash"
        }
    }
}
Restart the Logstash service
systemctl restart logstash
Kibana configuration
Set up a new pattern index
logtrail-messages*in the ITRS Log Analytics configuration. The procedure is described in the chapter First login.Add a new configuration section in the LogTrail configuration file:
vi /usr/share/kibana/plugins/logtrail/logtrail.json
{
  "index_patterns" : [
    {
      "es": {
        "default_index": "logstash-message-*",
        "allow_url_parameter": false
      },
      "tail_interval_in_seconds": 10,
      "es_index_time_offset_in_seconds": 0,
      "display_timezone": "Etc/UTC",
      "display_timestamp_format": "MMM DD HH:mm:ss",
      "max_buckets": 500,
      "default_time_range_in_days" : 0,
      "max_hosts": 100,
      "max_events_to_keep_in_viewer": 5000,
      "fields" : {
        "mapping" : {
            "timestamp" : "@timestamp",
            "display_timestamp" : "@timestamp",
            "hostname" : "hostname",
            "program": "program",
            "message": "syslog_message"
        },
        "message_format": "{{{syslog_message}}}"
      },
      "color_mapping" : {
        "field": "level",
        "mapping" : {
          "0": "#ff0000",
          "1": "#ff3232",
          "2": "#ff4c4c",
          "3": "#ff7f24",
          "4": "#ffb90f",
          "5": "#a2cd5a"
        }
      }
    }
  ]
}
Restate the Kibana service
systemctl restart kibana
Using Logtrail
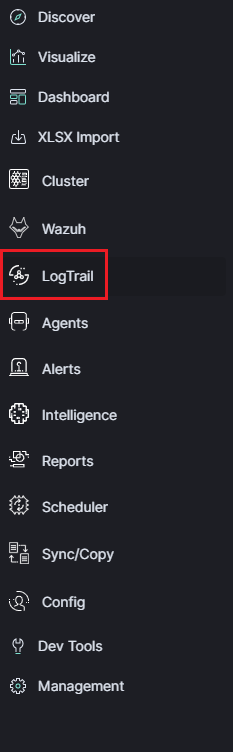
To access of the LogTrail module, click the tile icon from the main menu bar and then go to the „LogTrail” icon.
The main module window contains the content of messages that are automatically updated.
Below is the search and options bar.

It allows you to search for event logs, define the systems from which events will be displayed, define the time range for events and define the index pattern.
Tenable.sc
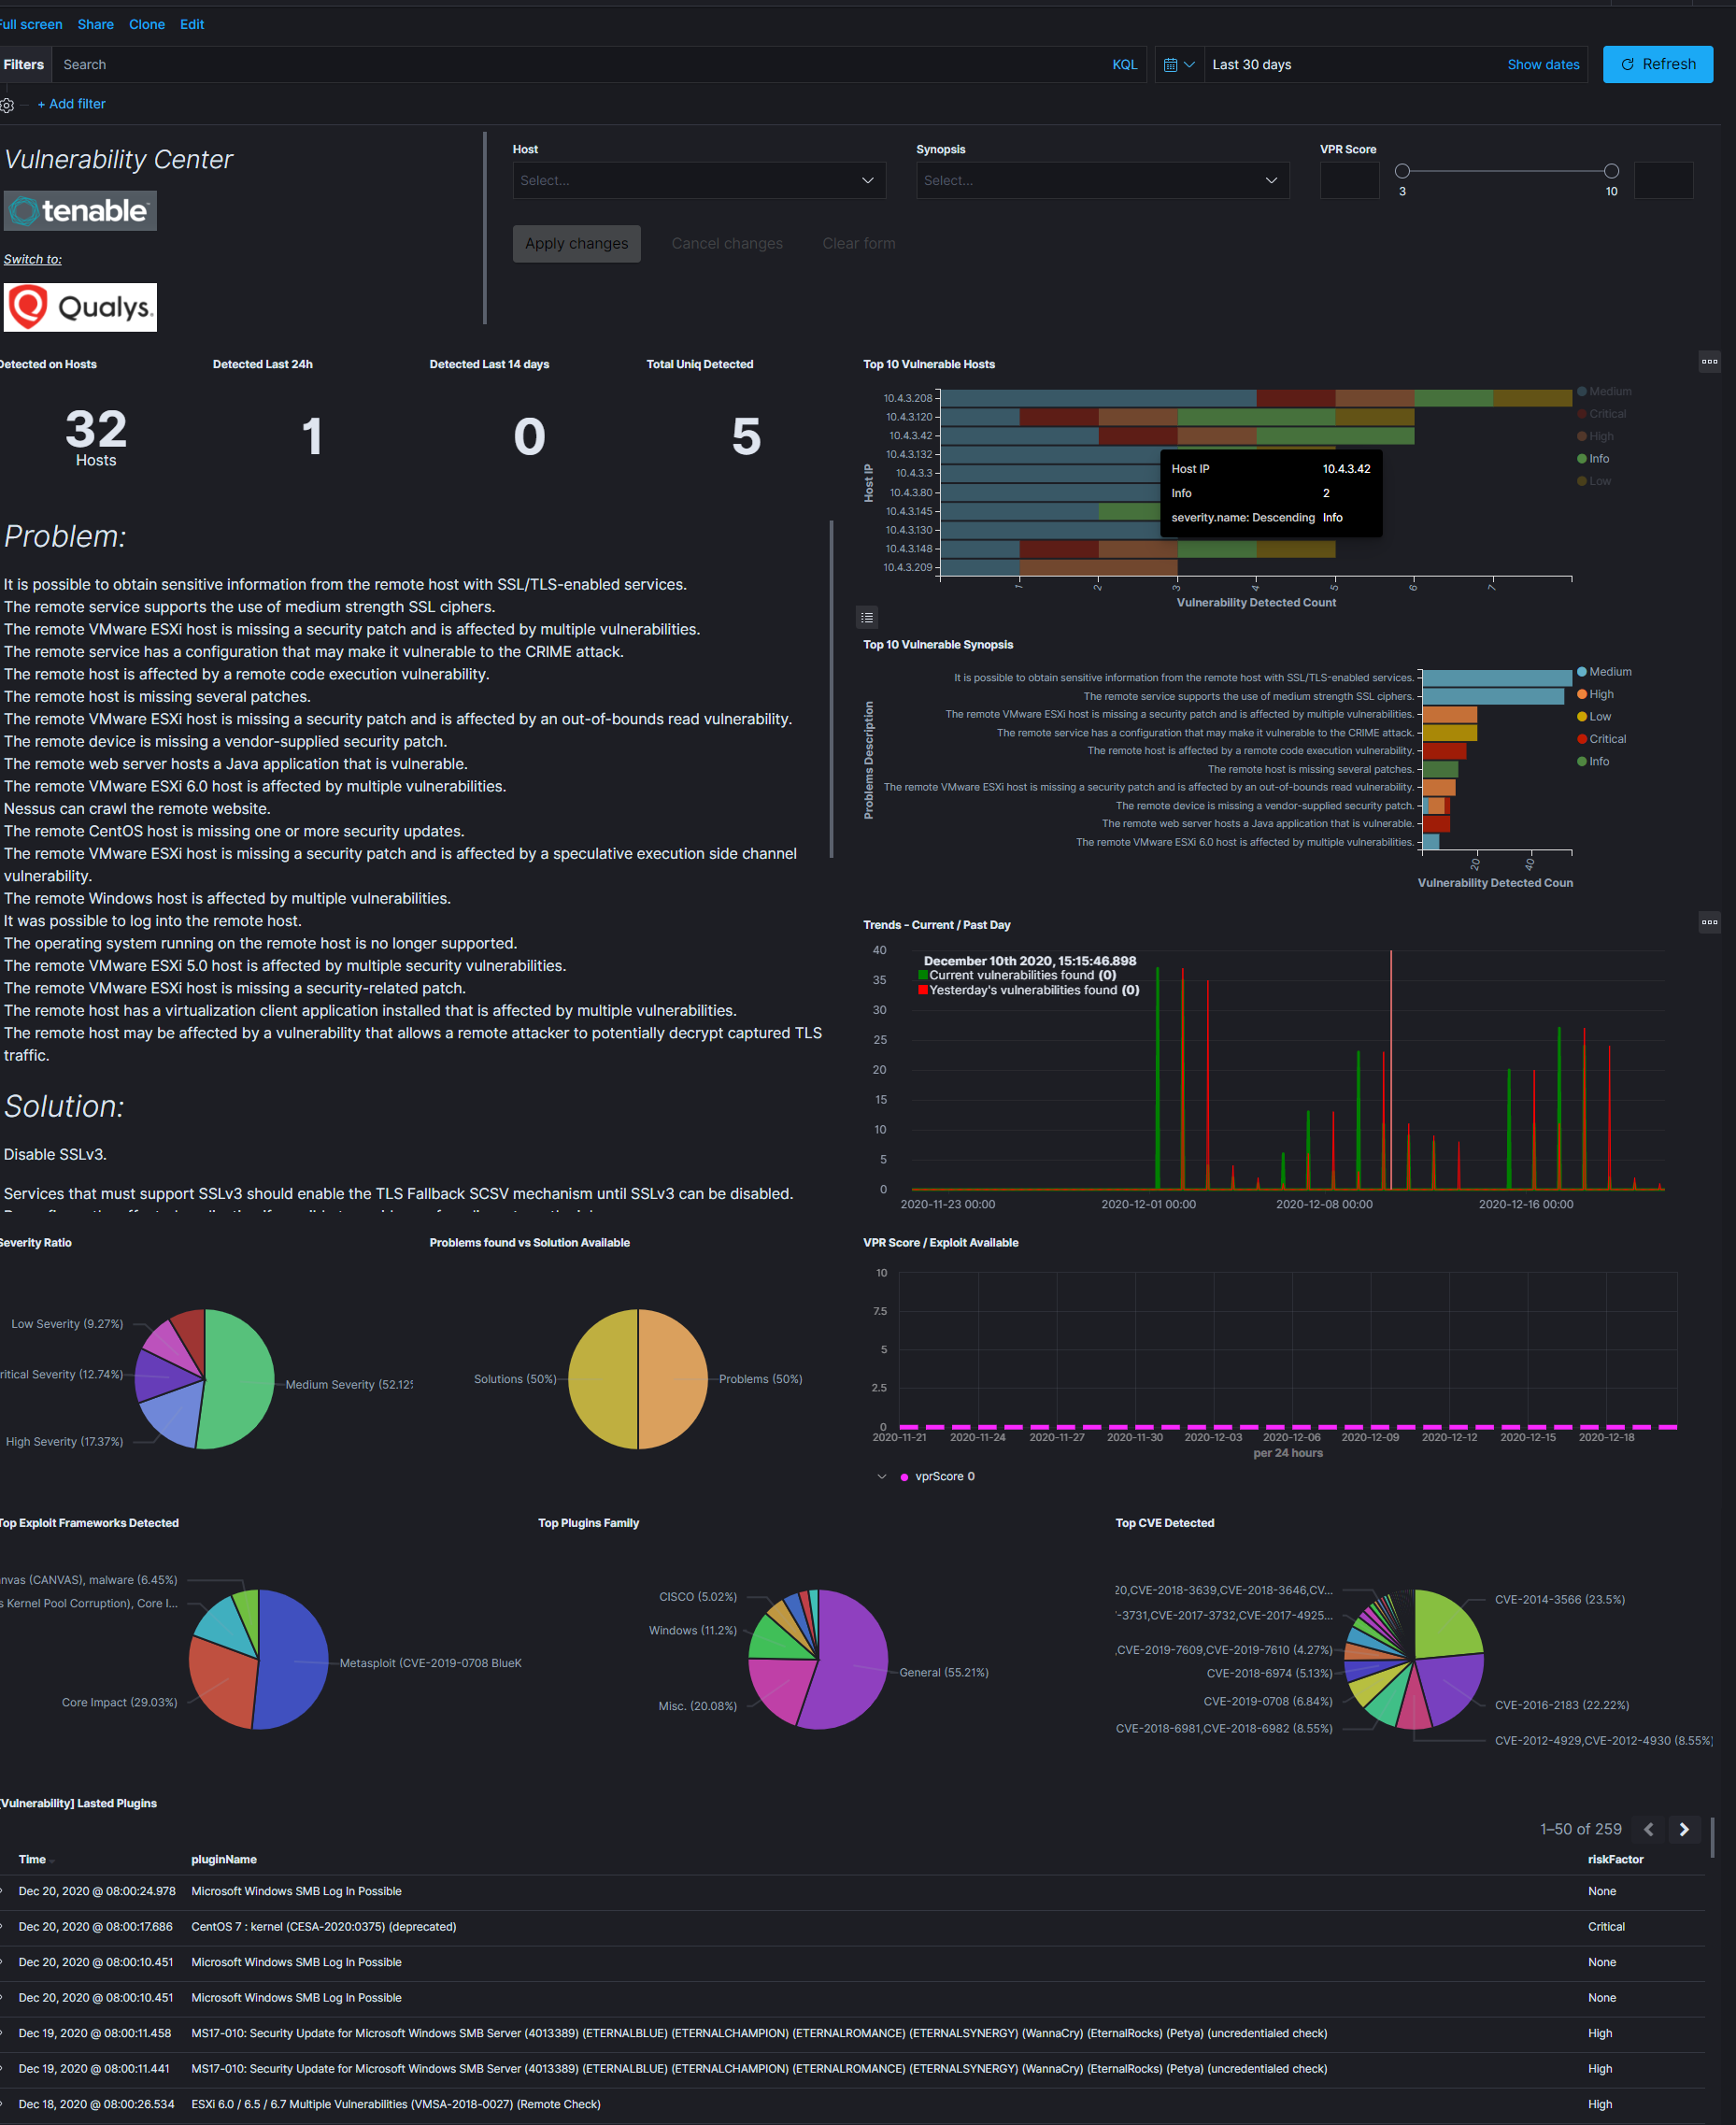
Tenable.sc is vulnerability management tool, which make a scan systems and environments to find vulnerabilities. The Logstash collector can connect to Tebable.sc API to get results of the vulnerability scan and send it to the Elasticsarch index. Reporting and analysis of the collected data is carried out using a prepared dashboard [Vulnerability] Overview Tenable
Configuration
enable pipeline in Logstash configuration:
vim /etc/logstash/pipelines.yml
uncomment following lines:
- pipeline.id: tenable.sc
  path.config: "/etc/logstash/conf.d/tenable.sc/*.conf"
configure connection to Tenable.sc manager:
vim /etc/logstash/conf.d/tenable.sc/venv/main.py
set of the connection parameters:
- TENABLE_ADDR - IP address and port Tenable.sc manger;
- TENABLE_CRED - user and password;
- LOGSTASH_ADDR = IP addresss and port Logstash collector;
example:
TENABLE_ADDR = ('10.4.3.204', 443)
TENABLE_CRED = ('admin', 'passowrd')
LOGSTASH_ADDR = ('127.0.0.1', 10000)
Qualys Guard
Qualys Guard is vulnerability management tool, which make a scan systems and environments to find vulnerabilities. The Logstash collector can connect to Qualys Guard API to get results of the vulnerability scan and send it to the Elasticsarch index. Reporting and analysis of the collected data is carried out using a prepared dashboard [Vulnerability] Overview Tenable
Configuration
enable pipeline in Logstash configuration:
vim /etc/logstash/pipelines.yml
uncomment following lines:
- pipeline.id: qualys
  path.config: "/etc/logstash/conf.d/qualys/*.conf"
configure connection to Qualys Guard manager:
vim /etc/logstash/conf.d/qualys/venv/main.py
set of the connection parameters:
- LOGSTASH_ADDR - IP address and port of the Logstash collector;
- hostname - IP address and port of the Qualys Guard manger;
- username - user have access to Qualys Guard manger;
- password - password for user have access to Qualys Guard manger.
example:
LOGSTASH_ADDR = ('127.0.0.1', 10001)

# connection settings
conn = qualysapi.connect(
    username="emcas5ab1",
    password="Lewa#stopa1",
    hostname="qualysguard.qg2.apps.qualys.eu"
)
Embedding dashboard in iframe
It is possible to send alerts containing HTML iframe as notification content. For example:
<a href="https://siem-vip:5601/app/kibana#/discover/72503360-1b25-11ea-bbe4-d7be84731d2c?_g=%28refreshInterval%3A%28display%3AOff%2Csection%3A0%2Cvalue%3A0%29%2Ctime%3A%28from%3A%272021-03-03T08%3A36%3A50Z%27%2Cmode%3Aabsolute%2Cto%3A%272021-03-04T08%3A36%3A50Z%27%29%29" target="_blank" rel="noreferrer">https://siem-vip:5601/app/kibana#/discover/72503360-1b25-11ea-bbe4-d7be84731d2c?_g=%28refreshInterval%3A%28display%3AOff%2Csection%3A0%2Cvalue%3A0%29%2Ctime%3A%28from%3A%272021-03-03T08%3A36%3A50Z%27%2Cmode%3Aabsolute%2Cto%3A%272021-03-04T08%3A36%3A50Z%27%29%29</a>
If you want an existing HTTP session to be used to display the iframe content, you need to set the following parameters in the /etc/kibana/kibana.yml file:
login.isSameSite: "Lax"
login.isSecure: true
Possible values for isSameSite are: “None”, “Lax”, “Strict”, false
For isSecure: false or true
Logstash
The ITRS Log Analytics use Logstash service to dynamically unify data from disparate sources and normalize the data into destination of your choose. A Logstash pipeline has two required elements, input and output, and one optional element filter. The input plugins consume data from a source, the filter plugins modify the data as you specify, and the output plugins write the data to a destination. The default location of the Logstash plugin files is: /etc/logstash/conf.d/. This location contain following ITRS Log Analytics
ITRS Log Analytics default plugins:
01-input-beats.conf01-input-syslog.conf01-input-snmp.conf01-input-http.conf01-input-file.conf01-input-database.conf020-filter-beats-syslog.conf020-filter-network.conf099-filter-geoip.conf100-output-elasticsearch.confnaemon_beat.exampleperflogs.example
Logstash - Input “beats”
This plugin wait for receiving data from remote beats services. It use tcp /5044 port for communication:
            input {
                    beats {
                            port => 5044
                    }
            }
Logstash - Input “network”
This plugin read events over a TCP or UDP socket assigns the appropriate tags:
	input {
	        tcp {
	                port => 5514
	                type => "network"

	                tags => [ "LAN", "TCP" ]
	        }

	        udp {
	                port => 5514
	                type => "network"

	                tags => [ "LAN", "UDP" ]
	        }
	}
To redirect the default syslog port (514/TCP/UDP) to the dedicated collector port, follow these steps:
firewall-cmd --add-forward-port=port=514:proto=udp:toport=5514:toaddr=127.0.0.1 --permanent
firewall-cmd --add-forward-port=port=514:proto=tcp:toport=5514:toaddr=127.0.0.1 --permanent
firewall-cmd --reload
systemctl restart firewalld
Logstash - Input SNMP
The SNMP input polls network devices using Simple Network Management Protocol (SNMP) to gather information related to the current state of the devices operation:
	input {
	  snmp {
	    get => ["1.3.6.1.2.1.1.1.0"]
	    hosts => [{host => "udp:127.0.0.1/161" community => "public" version => "2c"  retries => 2  timeout => 1000}]
	  }
	}
Logstash - Input HTTP / HTTPS
Using this input you can receive single or multiline events over http(s). Applications can send an HTTP request to the endpoint started by this input and Logstash will convert it into an event for subsequent processing. Sample definition:
	input {
	 http {
	    host => "0.0.0.0"
	    port => "8080"
	  }
	}
Events are by default sent in plain text. You can enable encryption by setting ssl to true and configuring the ssl_certificate and ssl_key options:
	input {
	 http {
	    host => "0.0.0.0"
	    port => "8080"
	    ssl => "true"
	    ssl_certificate => "path_to_certificate_file"
	    ssl_key => "path_to_key_file"
	  }
	}
Logstash - Input File
This plugin stream events from files, normally by tailing them in a manner similar to tail -0F but optionally reading them from the beginning. Sample definition:
	file {
	    path => "/tmp/access_log"
	    start_position => "beginning"
	  }
Logstash - Input database
This plugin can read data in any database with a JDBC interface into Logstash. You can periodically schedule ingestion using a cron syntax (see schedule setting) or run the query one time to load data into Logstash. Each row in the resultset becomes a single event. Columns in the resultset are converted into fields in the event.
Logasth input - MySQL
Download jdbc driver: https://dev.mysql.com/downloads/connector/j/
Sample definition:
input {
  jdbc {
    jdbc_driver_library => "mysql-connector-java-5.1.36-bin.jar"
    jdbc_driver_class => "com.mysql.jdbc.Driver"
    jdbc_connection_string => "jdbc:mysql://localhost:3306/mydb"
    jdbc_user => "mysql"
    jdbc_password => "mysql"
    parameters => { "favorite_artist" => "Beethoven" }
    schedule => "* * * * *"
    statement => "SELECT * from songs where artist = :favorite_artist"
  }
}
Logasth input - MSSQL
Download jdbc driver: https://docs.microsoft.com/en-us/sql/connect/jdbc/download-microsoft-jdbc-driver-for-sql-server?view=sql-server-ver15
Sample definition:
input {
  jdbc {
    jdbc_driver_library => "./mssql-jdbc-6.2.2.jre8.jar"
    jdbc_driver_class => "com.microsoft.sqlserver.jdbc.SQLServerDriver"
    jdbc_connection_string => "jdbc:sqlserver://VB201001000;databaseName=Database;"
    jdbc_user => "mssql"
    jdbc_password => "mssql"
    jdbc_default_timezone => "UTC"
    statement_filepath => "/usr/share/logstash/plugin/query"
    schedule => "*/5 * * * *"
    sql_log_level => "warn"
    record_last_run => "false"
    clean_run => "true"
  }
}
Logstash input - Oracle
Download jdbc driver: https://www.oracle.com/database/technologies/appdev/jdbc-downloads.html
Sample definition:
input {
  jdbc {
    jdbc_driver_library => "./ojdbc8.jar"
    jdbc_driver_class => "oracle.jdbc.driver.OracleDriver"
    jdbc_connection_string => "jdbc:oracle:thin:@hostname:PORT/SERVICE"
    jdbc_user => "oracle"
    jdbc_password => "oracle"
    parameters => { "favorite_artist" => "Beethoven" }
    schedule => "* * * * *"
    statement => "SELECT * from songs where artist = :favorite_artist"
  }
}
Logstash input - PostgreSQL
Download jdbc driver: https://jdbc.postgresql.org/download.html
Sample definition:
input {
    jdbc {
        jdbc_driver_library => "D:/postgresql-42.2.5.jar"
        jdbc_driver_class => "org.postgresql.Driver"
        jdbc_connection_string => "jdbc:postgresql://127.0.0.1:57610/mydb"
        jdbc_user => "myuser"
        jdbc_password => "mypw"
        statement => "select * from mytable"
    }
}
Logstash - Input CEF
The common event format (CEF) is a standard for the interoperability of event or log generating devices and applications. The standard defines a syntax for log records. It comprises of a standard prefix and a variable extension that is formatted as key-value pairs.
input {
  tcp {
    codec => cef { delimiter => "\r\n" }
    port => 12345
  }
}
This setting allows the following character sequences to have special meaning:
\r(backslash “r”) - means carriage return (ASCII 0x0D)\n(backslash “n”) - means newline (ASCII 0x0A)
Logstash - Input OPSEC
FW1-LogGrabber is a Linux command-line tool to grab logfiles from remote Checkpoint devices. It makes extensive use of OPSEC Log Export APIs (LEA) from Checkpoint’s OPSEC SDK 6.0 for Linux 50.
Build FW1-LogGrabber
FW1-LogGrabber v2.0 and above can be built on Linux x86/amd64 platforms only.
If you are interested in other platforms please check FW1-LogGrabber v1.11.1 website
Download dependencies
FW1-LogGrabber uses API-functions from Checkpoint’s OPSEC SDK 6.0 for Linux 50.
You must take care of downloading the Checkpoint OPSEC SDK and extracting it inside the OPSEC_SDK folder.
You also need to install some required 32-bit libraries.
If you are using Debian or Ubuntu, please run:
sudo apt-get install gcc-multilib g++-multilib libelf-dev:i386 libpam0g:i386 zlib1g-dev:i386
If you are using CentOS or RHEL, please run:
sudo yum install gcc gcc-c++ make glibc-devel.i686 elfutils-libelf-devel.i686 zlib-devel.i686 libstdc++-devel.i686 pam-devel.i686
Compile source code
Building should be as simple as running GNU Make in the project root folder:
make
If the build process complains, you might need to tweak some variables inside the Makefile (e.g. CC, LD and OPSEC_PKG_DIR) according to your environment.
Install FW1-LogGrabber
To install FW1-LogGrabber into its default location /usr/local/fw1-loggrabber (defined by INSTALL_DIR variable), please run
sudo make install
Set environment variables
FW1-LogGraber makes use of two environment variables, which should be defined in the shell configuration files.
LOGGRABBER_CONFIG_PATHdefines a directory containing configuration files (fw1-loggrabber.conf,lea.conf). If the variable is not defined, the program expects to find these files in the current directory.LOGGRABBER_TEMP_PATHdefines a directory where FW1-LogGrabber will store temporary files. If the variable is not defined, the program stores these files in the current directory.
Since the binary is dynamically linked to Checkpoint OPSEC libraries, please also add /usr/local/fw1-loggrabber/lib to LD_LIBRARY_PATH or to your dynamic linker configuration with
sudo echo /usr/local/fw1-loggrabber/lib > /etc/ld.so.conf.d/fw1-loggrabber.conf
sudo ldconfig
Configuration files
lea.conf file
Starting with version 1.11, FW1-LogGrabber uses the default connection configuration procedure for OPSEC applications. This includes server, port and authentication settings. From now on, all this parameters can only be configured using the configuration file lea.conf (see --leaconfigfile option to use a different LEA configuration file) and not using the command-line as before.
lea_server ip <IP address>specifies the IP address of the FW1 management station, to which FW1-LogGrabber should connect to.lea_server port <port number>is the port on the FW1 management station to which FW1-LogGrabber should connect to (for unauthenticated connections only).lea_server auth_port <port number>is the port to be used for authenticated connection to your FW1 management station.lea_server auth_type <authentication mechanism>you can use this parameter to specify the authentication mechanism to be used (default issslca); valid values aresslca,sslca_clear,sslca_comp,sslca_rc4,sslca_rc4_comp,asym_sslca,asym_sslca_comp,asym_sslca_rc4,asym_sslca_rc4_comp,ssl,ssl_opsec,ssl_clear,ssl_clear_opsec,fwn1andauth_opsec.opsec_sslca_file <p12-file>specify the location of the PKCS#12 certificate, when using authenticated connections.opsec_sic_name <LEA client SIC name>is the SIC name of the LEA client for authenticated connections.lea_server opsec_entity_sic_name <LEA server SIC name>is the SIC name of your FW1 management station when using authenticated connections.
fw1-loggrabber.conf file
This paragraph deals with the options that can be set within the configuration file. The default configuration file is fw1-loggrabber.conf (see --configfile option to use a different configuration file). The precedence of given options is as follows: command line, configuration file, default value. E.g. if you set the resolve-mode to be used in the configuration file, this can be overwritten by command line option --noresolve; only if an option isn’t set neither on command line nor in the configuration file, the default value will be used.
DEBUG_LEVEL=<0-3>sets the debug level to the specified value; zero means no output of debug information, and further levels will cause output of program specific as well as OPSEC specific debug information.FW1_LOGFILE=<name of log file>specifies the name of the FW1 logfile to be read; this can be either done exactly or using only a part of the filename; if no exact match can be found in the list of logfiles returned by the FW-1 management station, all logfiles which contain the specified string are processed; if this parameter is omitted, the default logfilefw.logwill be processed.FW1_OUTPUT=<files|logs>specifies whether FW1-LogGrabber should only display the available logfiles (files) on the FW11 server or display the content of these logfiles (logs).FW1_TYPE=<ng|2000>choose which version of FW1 to connect to; for Checkpoint FW-1 5.0 you have to specifyNGand for Checkpoint FW-1 4.1 you have to specify2000.FW1_MODE=<audit|normal>specifies whether to displayauditlogs, which contain administrative actions, ornormalsecurity logs, which contain data about dropped and accepted connections.MODE=<online|online-resume|offline>when using online mode, FW1-LogGrabber starts retrieving logging data from the end of the specified logfile and displays all future log entries (mainly used for continuously processing); the online-resume mode is similar to the online mode, but if FW1-LogGrabber is stopped and started again, it resumes processing from where it was stopped; if you instead choose the offline mode, FW1-LogGrabber quits after having displayed the last log entry.RESOLVE_MODE=<yes|no>with this option (enabled by default), IP addresses will be resolved to names using FW1 name resolving behaviour; this resolving mechanism will not cause the machine running FW1-LogGrabber to initiate DNS requests, but the name resolution will be done directly on the FW1 machine; if you disable resolving mode, IP addresses will be displayed in log output instead of names.RECORD_SEPARATOR=<char>can be used to change the default record separator|(pipe) into another character; if you choose a character which is contained in some log data, the occurrence within the logdata will be escaped by a backslash.LOGGING_CONFIGURATION=<screen|file|syslog>can be used for redirecting logging output to other destinations than the default destinationSTDOUT; currently it is possible to redirect output to a file or to the syslog daemon.OUTPUT_FILE_PREFIX=<prefix of output file>when using file output, this parameter defines a prefix for the output filename; default value is simplyfw1-loggrabber.OUTPUT_FILE_ROTATESIZE=<rotatesize in bytes>when using file output, this parameter specifies the maximum size of the output files, before they will be rotated with suffix-YYYY-MM-DD-hhmmss[-x].log; default value is 1048576 bytes, which equals 1 MB; setting a zero value disables file rotation.SYSLOG_FACILITY=<USER|LOCAL0|...|LOCAL7>when using syslog output, this parameter sets the syslog facility to be used.FW1_FILTER_RULE="<filterexpression1>[;<filterexpression2>]"defines filters fornormallog mode; you can find a more detailed description of filter rules, along with some examples, in a separate chapter below.AUDIT_FILTER_RULE="<filterexpression1>[;<filterexpression2>]"defines filters forauditlog mode; you can find a more detailed description of filter rules, along with some examples, in a separate chapter below.
Command line options
In the following section, all available command line options are described in detail. Most of the options can also be configured using the file fw1-loggrabber.conf (see --configfile option to use a different configuration file). The precedence of given options is as follows: command line, configuration file, default value. E.g. if you set the resolve-mode to be used in the configuration file, this can be overwritten by command line option --noresolve; only if an option isn’t set neither on command line nor in the configuration file, the default value will be used.
Help
Use --help to display basic help and usage information.
Debug level
The --debuglevel option sets the debug level to the specified value. A zero debug level means no output of debug information, while further levels will cause output of program specific as well as OPSEC specific debug
information.
Location of configuration files
The -c <configfilename> or --configfile <configfilename> options allow to specify a non-default configuration file, in which most of the command line options can be configured, as well as other options which are not available as command line parameters.
If this parameter is omitted, the file fw1-loggrabber.conf inside $LOGGRABBER_CONFIG_PATH will be used. See above for a description of all available configuration file options.
Using -l <leaconfigfilename> or --leaconfigfile <leaconfigfilename> instead, it’s possible to use a non-default LEA configuration file. In this file, all connection parameters such as FW1 server, port, authentication method as well as SIC names have to be configured, as usual procedure for OPSEC applications.
If this parameter is omitted, the file lea.conf inside $LOGGRABBER_CONFIG_PATH will be used. See above for a description of all available LEA configuration file options.
Remote log files
With -f <logfilename|pattern|ALL> or --logfile <logfilename|pattern|ALL> you can specify the name of the remote FW1 logfile to be read.
This can be either done exactly or using only a part of the filename. If no exact match can be found in the list of logfiles returned by the FW1 management station, all logfiles which contain the specified string are processed.
A special case is the usage of ALL instead of a logfile name or pattern. In that case all logfiles that are available on the management station, will be processed. If this parameter is omitted, only the default logfile fw.log will be processed.
The first example displays the logfile 2003-03-27_213652.log, while the second one processes all logfiles which contain 2003-03 in their filename.
--logfile 2003-03-27_213652.log
--logfile 2003-03
The default behaviour of FW1-LogGrabber is to display the content of the logfiles and not just their names. This can be explicitely specified using the --showlogs option.
The option --showfiles can be used instead to simply show the available logfiles on the FW1 management station. After the names of the logfiles have been displayed, FW1-LogGrabber quits.
Name resolving behaviour
Using the --resolve option, IP addresses will be resolved to names using FW1 name resolving behaviour. This resolving mechanism will not cause the machine running FW1-LogGrabber to initiate DNS requests, but the name resolution will be done directly on the FW1 machine.
This is the default behavior of FW1-LogGrabber which can be disabled by using --no-resolve. That option will cause IP addresses to be displayed in log output instead of names.
Checkpoint firewall version
The default FW1 version, for which this tool is being developed, is Checkpoint FW1 5.0 (NG) and above. If no other version is explicitly specified, the default version is --ng.
The option --2000 has to be used if you want to connect to older Checkpoint FW1 4.1 (2000) firewalls. You should keep in mind that some options are not available for non-NG firewalls; these include --auth, --showfiles, --auditlog and some more.
Online and Online-Resume modes
Using --online mode, FW1-LogGrabber starts output of logging data at the end of the specified logfile (or fw.log if no logfile name has been specified). This mode is mainly used for continuously processing FW1 log data and continues to display log entries also after scheduled and manual log switches. If you use --logfile to specify another logfile to be processed, you have to consider that no data will be shown, if the file isn’t active anymore.
The --online-resume mode is similar to the above online mode, but starts output of logging data at the last known processed position (which is stored inside a cursor).
In contrast to online mode, when using --offline mode FW1-LogGrabber quits after having displayed the last
log entry. This is the default behavior and is mainly used for analysis of historic log data.
Audit and normal logs
Using the --auditlog mode, content of the audit logfile (fw.adtlog) can be displayed. This includes administrator actions and uses different fields than normal log data.
The default --normallog mode of FW1-LogGrabber processes normal FW1 logfiles. In contrast to the --auditlog option, no administrative actions are displayed in this mode, but all regular log data is.
Filtering
Filter rules provide the possibility to display only log entries that match a given set of rules. There can be
specified one or more filter rules using one or multiple --filter arguments on the command line.
All individual filter rules are related by OR. That means a log entry will be displayed if at least one of the filter rules matches. You can specify multiple argument values by separating the values by , (comma).
Within one filter rule, there can be specified multiple arguments which have to be separated by ; (semi-colon). All these arguments are related by AND. That means a filter rule matches a given log entry only, if all of the filter arguments match.
If you specify != instead of = between name and value of the filter argument, you can negate the name/value pair.
For arguments that expect IP addresses, you can specify either a single IP address, multiple IP addresses separated by , (comma) or a network address with netmask (e.g. 10.0.0.0/255.0.0.0). Currently it is not possible to specify a network address and a single IP address within the same filter argument.
Supported filter arguments
Normal mode:
action=<ctl|accept|drop|reject|encrypt|decrypt|keyinst>
dst=<IP address>
endtime=<YYYYMMDDhhmmss>
orig=<IP address>
product=<VPN-1 & FireWall-1|SmartDefense>
proto=<icmp|tcp|udp>
rule=<rulenumber|startrule-endrule>
service=<portnumber|startport-endport>
src=<IP address>
starttime=<YYYYMMDDhhmmss>
Audit mode:
action=<ctl|accept|drop|reject|encrypt|decrypt|keyinst>
administrator=<string>
endtime=<YYYYMMDDhhmmss>
orig=<IP address>
product=<SmartDashboard|Policy Editor|SmartView Tracker|SmartView Status|SmartView Monitor|System Monitor|cpstat_monitor|SmartUpdate|CPMI Client>
starttime=<YYYYMMDDhhmmss>
Example filters
Display all dropped connections:
--filter "action=drop"
Display all dropped and rejected connections:
--filter "action=drop,reject"
--filter "action!=accept"
Display all log entries generated by rules 20 to 23:
--filter "rule=20,21,22,23"
--filter "rule=20-23"
Display all log entries generated by rules 20 to 23, 30 or 40 to 42:
--filter "rule=20-23,30,40-42"
Display all log entries to 10.1.1.1 and 10.1.1.2:
--filter "dst=10.1.1.1,10.1.1.2"
Display all log entries from 192.168.1.0/255.255.255.0:
--filter "src=192.168.1.0/255.255.255.0"
Display all log entries starting from 2004/03/02 14:00:00:
--filter "starttime=20040302140000"
Checkpoint device configuration
Modify $FWDIR/conf/fwopsec.conf and define the port to be used for authenticated LEA connections (e.g. 18184):
lea_server port 0
lea_server auth_port 18184
lea_server auth_type sslca
Restart in order to activate changes:
cpstop; cpstart
Create a new OPSEC Application Object with the following details:
Name: e.g. myleaclient
Vendor: User Defined
Server Entities: None
Client Entities: LEA
Initialize Secure Internal Communication (SIC) for recently created OPSEC Application Object and enter (and remember) the activation key (e.g. def456).
Write down the DN of the recently created OPSEC Application Object; this is your Client Distinguished Name, which you need later on.
Open the object of your FW1 management server and write down the DN of that object; this is the Server Distinguished Name, which you will need later on.
Add a rule to the policy to allow the port defined above as well as port 18210/tcp (FW1_ica_pull) in order to allow pulling of PKCS#12 certificate by the FW1-LogGrabber machine from the FW1 management server. Port 18210/tcp can be shut down after the communication between FW1-LogGrabber and the FW1 management server has been established successfully.
Finally, install the policy.
FW1-LogGrabber configuration
Modify $LOGGRABBER_CONFIG_PATH/lea.conf and define the IP address of your FW1 management station (e.g. 10.1.1.1) as well as port (e.g. 18184), authentication type and SIC names for authenticated LEA
connections. You can get the SIC names from the object properties of your LEA client object, respectively the
Management Station object (see above for details about Client DN and Server DN).
lea_server ip 10.1.1.1
lea_server auth_port 18184
lea_server auth_type sslca
opsec_sslca_file opsec.p12
opsec_sic_name "CN=myleaclient,O=cpmodule..gysidy"
lea_server opsec_entity_sic_name "cn=cp_mgmt,o=cpmodule..gysidy"
Get the tool opsec_pull_cert either from opsec-tools.tar.gz from the project home page or directly from the OPSEC SDK. This tool is needed to establish the Secure Internal Communication (SIC) between FW1-LogGrabber and the FW1 management server.
Get the clients certificate from the management station (e.g. 10.1.1.1). The activation key has to be the same as specified before in the firewall policy. After that, copy the resulting PKCS#12 file (default name opsec.p12) to your FW1-LogGrabber directory.
opsec_pull_cert -h 10.1.1.1 -n myleaclient -p def456
Authenticated SSL OPSEC connections
Checkpoint device configuration
Modify $FWDIR/conf/fwopsec.conf and define the port to be used for authenticated LEA connections (e.g. 18184):
lea_server port 0
lea_server auth_port 18184
lea_server auth_type ssl_opsec
Restart in order to activate changes:
cpstop; cpstart
Set a password (e.g. abc123) for the LEA client (e.g. 10.1.1.2):
fw putkey -ssl -p abc123 10.1.1.2
Create a new OPSEC Application Object with the following details:
Name: e.g. myleaclient
Vendor: User Defined
Server Entities: None
Client Entities: LEA
Initialize Secure Internal Communication (SIC) for recently created OPSEC Application Object and enter (and remember) the activation key (e.g. def456).
Write down the DN of the recently created OPSEC Application Object; this is your Client Distinguished Name, which you need later on.
Open the object of your FW1 management server and write down the DN of that object; this is the Server Distinguished Name, which you will need later on.
Add a rule to the policy to allow the port defined above as well as port 18210/tcp (FW1_ica_pull) in order to allow pulling of PKCS#12 certificate from the FW1-LogGrabber machine to the FW1 management server. The port 18210/tcp can be shut down after the communication between FW1-LogGrabber and the FW1 management server has been established successfully.
Finally, install the policy.
FW1-LogGrabber configuration
Modify $LOGGRABBER_CONFIG_PATH/lea.conf and define the IP address of your FW1 management station (e.g. 10.1.1.1) as well as port (e.g. 18184), authentication type and SIC names for authenticated LEA connections. The SIC names you can get from the object properties of your LEA client object respectively the Management Station object (see above for details about Client DN and Server DN).
lea_server ip 10.1.1.1
lea_server auth_port 18184
lea_server auth_type ssl_opsec
opsec_sslca_file opsec.p12
opsec_sic_name "CN=myleaclient,O=cpmodule..gysidy"
lea_server opsec_entity_sic_name "cn=cp_mgmt,o=cpmodule..gysidy"
Set password for the connection to the LEA server. The password has to be the same as specified on the LEA server.
opsec_putkey -ssl -p abc123 10.1.1.1
Get the tool opsec_pull_cert either from opsec-tools.tar.gz from the project home page or directly from the OPSEC SDK. This tool is needed to establish the Secure Internal Communication (SIC) between FW1-LogGrabber and the FW1 management server.
Get the clients certificate from the management station (e.g. 10.1.1.1). The activation key has to be the same as specified before in the firewall policy.
opsec_pull_cert -h 10.1.1.1 -n myleaclient -p def456
Authenticated OPSEC connections
Checkpoint device configuration
Modify $FWDIR/conf/fwopsec.conf and define the port to be used for authenticated LEA connections (e.g. 18184):
lea_server port 0
lea_server auth_port 18184
lea_server auth_type auth_opsec
Restart in order to activate changes
fwstop; fwstart
Set a password (e.g. abc123) for the LEA client (e.g. 10.1.1.2).
fw putkey -opsec -p abc123 10.1.1.2
Add a rule to the policy to allow the port defined above from the FW1-LogGrabber machine to the FW1 management server.
Finally, install the policy.
FW1-LogGrabber configuration
Modify $LOGGRABBER_CONFIG_PATH/lea.conf and define the IP address of your FW1 management station (e.g. 10.1.1.1) as well as port (e.g. 18184) and authentication type for authenticated LEA connections:
lea_server ip 10.1.1.1
lea_server auth_port 18184
lea_server auth_type auth_opsec
Set password for the connection to the LEA server. The password has to be the same as specified on the LEA server.
opsec_putkey -p abc123 10.1.1.1
Unauthenticated connections
Checkpoint device configuration
Modify $FWDIR/conf/fwopsec.conf and define the port to be used for unauthenticated LEA connections (e.g. 50001):
lea_server port 50001
lea_server auth_port 0
Restart in order to activate changes:
fwstop; fwstart  # for 4.1
cpstop; cpstart  # for NG
Add a rule to the policy to allow the port defined above from the FW1-LogGrabber machine to the FW1 management server.
Finally, install the policy.
FW1-LogGrabber configuration
Modify $LOGGRABBER_CONFIG_PATH/lea.conf and define the IP address of your FW1 management station (e.g. 10.1.1.1) and port (e.g. 50001) for unauthenticated LEA connections:
lea_server ip 10.1.1.1
lea_server port 50001
Logstash - Input SDEE
This Logstash input plugin allows you to call a Cisco SDEE/CIDEE HTTP API, decode the output of it into event(s), and send them on their merry way. The idea behind this plugins came from a need to gather events from Cisco security devices and feed them to ELK stack
Download
Only support for Logstash core 5.6.4.
Download link: https://rubygems.org/gems/logstash-input-sdee
Installation
gem install logstash-input-sdee-0.7.8.gem
Configuration
You need to import host SSL certificate in Java trust store to be able to connect to Cisco IPS device.
Get server certificate from IPS device:
echo | openssl s_client -connect ciscoips:443 2>&1 | sed -ne '/-BEGIN CERTIFICATE-/,/-END CERTIFICATE-/p' > cert.pem
Import it into Java ca certs:
$JAVA_HOME/bin/keytool -keystore $JAVA_HOME/lib/security/cacerts -importcert -alias ciscoips -file cert.pem
Verify if import was successful:
$JAVA_HOME/bin/keytool -keystore $JAVA_HOME/lib/security/cacerts -list
Setup the Logstash input config with SSL connection:
input {
  sdee {
    interval => 60
    http => {
      truststore_password => "changeit"
      url => "https://10.0.2.1"
      auth => {
        user => "cisco"
        password => "p@ssw0rd"
      }
    }
  }
}
Logstash - Input XML
To download xml files via Logstash use input “file”, and set the location of the files in the configuration file:
file {
       path => [ "/etc/logstash/files/*.xml" ]
       mode => "read"
  }
The XML filter takes a field that contains XML and expands it into an actual datastructure.
filter {
      xml {
        source => "message"
      }
    }
More configuration options you can find: https://www.elastic.co/guide/en/logstash/6.8/plugins-filters-xml.html#plugins-filters-xml-options
Logstash - Input WMI
The Logstash input wmi allow to collect data from WMI query. This is useful for collecting performance metrics and other data which is accessible via WMI on a Windows host.
Installation
For plugins not bundled by default, it is easy to install by running:
/usr/share/logstash/bin/logstash-plugin install logstash-input-wmi
Configuration
Configuration example:
input {
      wmi {
        query => "select * from Win32_Process"
        interval => 10
      }
      wmi {
        query => "select PercentProcessorTime from Win32_PerfFormattedData_PerfOS_Processor where name = '_Total'"
      }
      wmi { # Connect to a remote host
        query => "select * from Win32_Process"
        host => "MyRemoteHost"
        user => "mydomain\myuser"
        password => "Password"
      }
    }
More about parameters: https://www.elastic.co/guide/en/logstash/6.8/plugins-inputs-wmi.html#plugins-inputs-wmi-options
Logstash - Filter “beats syslog”
This filter processing an event data with syslog type:
	filter {

	 if [type] == "syslog" {
			grok {
					match => {
					  "message" => [
					# auth: ssh|sudo|su

					  "%{SYSLOGTIMESTAMP:[system][auth][timestamp]} %{SYSLOGHOST:[system][auth][hostname]} sshd(?:\[%{POSINT:[system][auth][pid]}\])?: %{DATA:[system][auth][ssh][event]} %{DATA:[system][auth][ssh][method]} for (invalid user )?%{DATA:[system][auth][user]} from %{IPORHOST:[system][auth][ssh][ip]} port %{NUMBER:[system][auth][ssh][port]} ssh2(: %{GREEDYDATA:[system][auth][ssh][signature]})?",

							  "%{SYSLOGTIMESTAMP:[system][auth][timestamp]} %{SYSLOGHOST:[system][auth][hostname]} sshd(?:\[%{POSINT:[system][auth][pid]}\])?: %{DATA:[system][auth][ssh][event]} user %{DATA:[system][auth][user]} from %{IPORHOST:[system][auth][ssh][ip]}",

							  "%{SYSLOGTIMESTAMP:[system][auth][timestamp]} %{SYSLOGHOST:[system][auth][hostname]} sshd(?:\[%{POSINT:[system][auth][pid]}\])?: Did not receive identification string from %{IPORHOST:[system][auth][ssh][dropped_ip]}",

							  "%{SYSLOGTIMESTAMP:[system][auth][timestamp]} %{SYSLOGHOST:[system][auth][hostname]} sudo(?:\[%{POSINT:[system][auth][pid]}\])?: \s*%{DATA:[system][auth][user]} :( %{DATA:[system][auth][sudo][error]} ;)? TTY=%{DATA:[system][auth][sudo][tty]} ; PWD=%{DATA:[system][auth][sudo][pwd]} ; USER=%{DATA:[system][auth][sudo][user]} ; COMMAND=%{GREEDYDATA:[system][auth][sudo][command]}",

							  "%{SYSLOGTIMESTAMP:[system][auth][timestamp]} %{SYSLOGHOST:[system][auth][hostname]} %{DATA:[system][auth][program]}(?:\[%{POSINT:[system][auth][pid]}\])?: %{GREEDYMULTILINE:[system][auth][message]}",

					# add/remove user or group
							  "%{SYSLOGTIMESTAMP:[system][auth][timestamp]} %{SYSLOGHOST:[system][auth][hostname]} groupadd(?:\[%{POSINT:[system][auth][pid]}\])?: new group: name=%{DATA:system.auth.groupadd.name}, GID=%{NUMBER:system.auth.groupadd.gid}",

					  "%{SYSLOGTIMESTAMP:[system][auth][timestamp]} %{SYSLOGHOST:[system][auth][hostname]} userdel(?:\[%{POSINT:[system][auth][pid]}\])?: removed group '%{DATA:[system][auth][groupdel][name]}' owned by '%{DATA:[system][auth][group][owner]}'",

							  "%{SYSLOGTIMESTAMP:[system][auth][timestamp]} %{SYSLOGHOST:[system][auth][hostname]} useradd(?:\[%{POSINT:[system][auth][pid]}\])?: new user: name=%{DATA:[system][auth][user][add][name]}, UID=%{NUMBER:[system][auth][user][add][uid]}, GID=%{NUMBER:[system][auth][user][add][gid]}, home=%{DATA:[system][auth][user][add][home]}, shell=%{DATA:[system][auth][user][add][shell]}$",

					   "%{SYSLOGTIMESTAMP:[system][auth][timestamp]} %{SYSLOGHOST:[system][auth][hostname]} userdel(?:\[%{POSINT:[system][auth][pid]}\])?: delete user '%{WORD:[system][auth][user][del][name]}'$",

					   "%{SYSLOGTIMESTAMP:[system][auth][timestamp]} %{SYSLOGHOST:[system][auth][hostname]} usermod(?:\[%{POSINT:[system][auth][pid]}\])?: add '%{WORD:[system][auth][user][name]}' to group '%{WORD:[system][auth][user][memberof]}'",

					   # yum install/erase/update package
					   "%{SYSLOGTIMESTAMP:[system][auth][timestamp]} %{DATA:[system][package][action]}: %{NOTSPACE:[system][package][name]}"
					]

				}

					pattern_definitions => {
					  "GREEDYMULTILINE"=> "(.|\n)*"
					}
				  }

				date {
						match => [ "[system][auth][timestamp]",
						"MMM  d HH:mm:ss",
					"MMM dd HH:mm:ss"
					]
					target => "[system][auth][timestamp]"
				}

				mutate {
				  convert => { "[system][auth][pid]" => "integer" }
				  convert => { "[system][auth][groupadd][gid]" => "integer" }
				  convert => { "[system][auth][user][add][uid]" => "integer" }
				  convert => { "[system][auth][user][add][gid]" => "integer" }
				}
	  }
	}
Logstash - Filter “network”
This filter processing an event data with network type:
filter {
 if [type] == "network" {
     grok {
		named_captures_only => true
		match => {
			"message" => [

			# Cisco Firewall
			"%{SYSLOG5424PRI}%{NUMBER:log_sequence#}:%{SPACE}%{IPORHOST:device_ip}: (?:.)?%{CISCOTIMESTAMP:log_data} CET: %%{CISCO_REASON:facility}-%{INT:severity_level}-%{CISCO_REASON:facility_mnemonic}:%{SPACE}%{GREEDYDATA:event_message}",

			# Cisco Routers
			"%{SYSLOG5424PRI}%{NUMBER:log_sequence#}:%{SPACE}%{IPORHOST:device_ip}: (?:.)?%{CISCOTIMESTAMP:log_data} CET: %%{CISCO_REASON:facility}-%{INT:severity_level}-%{CISCO_REASON:facility_mnemonic}:%{SPACE}%{GREEDYDATA:event_message}",

			# Cisco Switches
			"%{SYSLOG5424PRI}%{NUMBER:log_sequence#}:%{SPACE}%{IPORHOST:device_ip}: (?:.)?%{CISCOTIMESTAMP:log_data} CET: %%{CISCO_REASON:facility}-%{INT:severity_level}-%{CISCO_REASON:facility_mnemonic}:%{SPACE}%{GREEDYDATA:event_message}",
			"%{SYSLOG5424PRI}%{NUMBER:log_sequence#}:%{SPACE}(?:.)?%{CISCOTIMESTAMP:log_data} CET: %%{CISCO_REASON:facility}-%{INT:severity_level}-%{CISCO_REASON:facility_mnemonic}:%{SPACE}%{GREEDYDATA:event_message}",

			# HP switches
			"%{SYSLOG5424PRI}%{SPACE}%{CISCOTIMESTAMP:log_data} %{IPORHOST:device_ip} %{CISCO_REASON:facility}:%{SPACE}%{GREEDYDATA:event_message}"
			]

		}
	}

	syslog_pri { }

	if [severity_level] {

	  translate {
	    dictionary_path => "/etc/logstash/dictionaries/cisco_syslog_severity.yml"
	    field => "severity_level"
	    destination => "severity_level_descr"
	  }

	}

	if [facility] {

	  translate {
	    dictionary_path => "/etc/logstash/dictionaries/cisco_syslog_facility.yml"
	    field => "facility"
	    destination => "facility_full_descr"
	  }

	}

	 #ACL
	 if [event_message] =~ /(\d+.\d+.\d+.\d+)/ {
	  grok {
	    match => {
		"event_message" => [
			"list %{NOTSPACE:[acl][name]} %{WORD:[acl][action]} %{WORD:[acl][proto]} %{IP:[src][ip]}.*%{IP:[dst][ip]}",
			"list %{NOTSPACE:[acl][name]} %{WORD:[acl][action]} %{IP:[src][ip]}",
			"^list %{NOTSPACE:[acl][name]} %{WORD:[acl][action]} %{WORD:[acl][proto]} %{IP:[src][ip]}.*%{IP:[dst][ip]}"
			]
	    }
	  }
	}

	if [src][ip] {

		cidr {
		   address => [ "%{[src][ip]}" ]
		   network => [ "0.0.0.0/32", "10.0.0.0/8", "172.16.0.0/12", "192.168.0.0/16", "fc00::/7", "127.0.0.0/8", "::1/128", "169.254.0.0/16", "fe80::/10","224.0.0.0/4", "ff00::/8","255.255.255.255/32"  ]
		   add_field => { "[src][locality]" => "private" }
		}

		if ![src][locality] {
		   mutate {
		      add_field => { "[src][locality]" => "public" }
		   }
		}
	}


	if [dst][ip] {
		cidr {
		   address => [ "%{[dst][ip]}" ]
		   network => [ "0.0.0.0/32", "10.0.0.0/8", "172.16.0.0/12", "192.168.0.0/16", "fc00::/7", "127.0.0.0/8", "::1/128",
				"169.254.0.0/16", "fe80::/10","224.0.0.0/4", "ff00::/8","255.255.255.255/32" ]
		   add_field => { "[dst][locality]" => "private" }
		}

		if ![dst][locality] {
		   mutate {
		      add_field => { "[dst][locality]" => "public" }
		   }
		}
	}

	# date format
	date {
	  match => [ "log_data",
		"MMM dd HH:mm:ss",
		"MMM  dd HH:mm:ss",
		"MMM dd HH:mm:ss.SSS",
		"MMM  dd HH:mm:ss.SSS",
		"ISO8601"
	  ]
	  target => "log_data"
	}

 }
}
Logstash - Filter “geoip”
This filter processing an events data with IP address and check localization:
filter {
     if [src][locality] == "public" {

		geoip {
			source => "[src][ip]"
			target => "[src][geoip]"
			database => "/etc/logstash/geoipdb/GeoLite2-City.mmdb"
			fields => [ "city_name", "country_name", "continent_code", "country_code2", "location" ]
			remove_field => [ "[src][geoip][ip]" ]
		}

		geoip {
			source => "[src][ip]"
			target => "[src][geoip]"
			database => "/etc/logstash/geoipdb/GeoLite2-ASN.mmdb"
			remove_field => [ "[src][geoip][ip]" ]
		}

     }

     if [dst][locality] == "public" {

		geoip {
			source => "[dst][ip]"
			target => "[dst][geoip]"
			database => "/etc/logstash/geoipdb/GeoLite2-City.mmdb"
			fields => [ "city_name", "country_name", "continent_code", "country_code2", "location" ]
			remove_field =>  [ "[dst][geoip][ip]" ]
		}

		geoip {
			source => "[dst][ip]"
			target => "[dst][geoip]"
			database => "/etc/logstash/geoipdb/GeoLite2-ASN.mmdb"
			remove_field => [ "[dst][geoip][ip]" ]
		}
     }

}
Logstash - avoiding duplicate documents
To avoid duplicating the same documents, e.g. if the collector receives the entire event log file on restart, prepare the Logstash filter as follows:
Use the fingerprint Logstash filter to create consistent hashes of one or more fields whose values are unique for the document and store the result in a new field, for example:
fingerprint {
                        source => [ "log_name", "record_number" ]
                        target => "generated_id"
                        method => "SHA1"
                }
- source - The name(s) of the source field(s) whose contents will be used to create the fingerprint
- target - The name of the field where the generated fingerprint will be stored. Any current contents of that field will be overwritten.
- method - If set to
SHA1,SHA256,SHA384,SHA512, orMD5and a key is set, the cryptographic hash function with the same name will be used to generate the fingerprint. When a key set, the keyed-hash (HMAC) digest function will be used.
In the elasticsearch output set the document_id as the value of the generated_id field:
elasticsearch {
                hosts => ["http://localhost:9200"]
                user => "logserver"
                password => "logserver"
                index => "syslog_wec-%{+YYYY.MM.dd}"
                document_id => "%{generated_id}"
        }
- document_id - The document ID for the index. Useful for overwriting existing entries in Elasticsearch with the same ID.
Documents having the same document_id will be indexed only once.
Logstash data enrichment
It is possible to enrich the events that go to the logstash filters with additional fields, the values of which come from the following sources:
- databases, using the
jdbcplugin; - Active Directory or OpenLdap, using the
logstash-filter-ldapplugin; - dictionary files, using the
translateplugin; - external systems using their API, e.g. OP5 Monitor/Nagios
Filter jdbc
This filter executes a SQL query and store the result set in the field specified as target. It will cache the results locally in an LRU cache with expiry.
For example, you can load a row based on an id in the event:
filter {
  jdbc_streaming {
    jdbc_driver_library => "/path/to/mysql-connector-java-5.1.34-bin.jar"
    jdbc_driver_class => "com.mysql.jdbc.Driver"
    jdbc_connection_string => "jdbc:mysql://localhost:3306/mydatabase"
    jdbc_user => "me"
    jdbc_password => "secret"
    statement => "select * from WORLD.COUNTRY WHERE Code = :code"
    parameters => { "code" => "country_code"}
    target => "country_details"
  }
}
More about jdbc plugin parameters: (https://www.elastic.co/guide/en/logstash/6.8/plugins-filters-jdbc_streaming.html
Filter logstash-filter-ldap
Download and installation
Configuration
The logstash-filter-ldap filter will add fields queried from a ldap server to the event. The fields will be stored in a variable called target, that you can modify in the configuration file.
If an error occurs during the process tha tags array of the event is updated with either:
- LDAP_ERROR tag: Problem while connecting to the server: bad host, port, username, password, or search_dn -> Check the error message and your configuration.
- LDAP_NOT_FOUND tag: Object wasn’t found.
If error logging is enabled a field called error will also be added to the event. It will contain more details about the problem.
Input event
{
    "@timestamp" => 2018-02-25T10:04:22.338Z,
    "@version" => "1",
    "myUid" => "u501565"
}
Logstash filter
filter {
  ldap {
    identifier_value => "%{myUid}"
    host => "my_ldap_server.com"
    ldap_port => "389"
    username => "<connect_username>"
    password => "<connect_password>"
    search_dn => "<user_search_pattern>"
  }
}
Output event
{
    "@timestamp" => 2018-02-25T10:04:22.338Z,
    "@version" => "1",
    "myUid" => "u501565",
    "ldap" => {
        "givenName" => "VALENTIN",
        "sn" => "BOURDIER"
    }
}
Parameters availables
Here is a list of all parameters, with their default value, if any, and their description.
|      Option name      | Type    | Required | Default value  | Description                                                  | Example                                   |
| :-------------------: | ------- | -------- | -------------- | ------------------------------------------------------------ | ----------------------------------------- |
|   identifier_value    | string  | yes      | n/a            | Identifier of the value to search. If identifier type is uid, then the value should be the uid to search for. | "123456"                                  |
|    identifier_key     | string  | no       | "uid"          | Type of the identifier to search                             | "uid"                                     |
|    identifier_type    | string  | no       | "posixAccount" | Object class of the object to search                         | "person"                                  |
|       search_dn       | string  | yes      | n/a            | Domain name in which search inside the ldap database (usually your userdn or groupdn) | "dc=example,dc=org"                       |
|      attributes       | array   | no       | []             | List of attributes to get. If not set, all attributes available will be get | ['givenName', 'sn']                       |
|        target         | string  | no       | "ldap"         | Name of the variable you want the result being stocked in    | "myCustomVariableName"                    |
|         host          | string  | yes      | n/a            | LDAP server host adress                                      | "ldapserveur.com"                         |
|       ldap_port       | number  | no       | 389            | LDAP server port for non-ssl connection                      | 400                                       |
|      ldaps_port       | number  | no       | 636            | LDAP server port for ssl connection                          | 401                                       |
|        use_ssl        | boolean | no       | false          | Enable or not ssl connection for LDAP  server. Set-up the good ldap(s)_port depending on that | true                                      |
| enable_error_logging  | boolean | no       | false          | When there is a problem with the connection with the LDAP database, write reason in the event | true                                      |
|   no_tag_on_failure   | boolean | no       | false          | No tags are added when an error (wrong credentials, bad server, ..) occur | true                                      |
|       username        | string  | no       | n/a            | Username to use for search in the database                   | "cn=SearchUser,ou=person,o=domain"        |
|       password        | string  | no       | n/a            | Password of the account linked to previous username          | "123456"                                  |
|       use_cache       | boolean | no       | true           | Choose to enable or not use of buffer                        | false                                     |
|      cache_type       | string  | no       | "memory"       | Type of buffer to use. Currently, only one is available, "memory" buffer | "memory"                                  |
| cache_memory_duration | number  | no       | 300            | Cache duration (in s) before refreshing values of it         | 3600                                      |
|   cache_memory_size   | number  | no       | 20000          | Number of object max that the buffer can contains            | 100                                       |
|  disk_cache_filepath  | string  | no       | nil            | Where the cache will periodically be dumped                  | "/tmp/my-memory-backup"                   |
|  disk_cache_schedule  | string  | no       | 10m            | Cron period of when the dump of the cache should occured. See [here](https://github.com/floraison/fugit) for the syntax. | "10m", "1h", "every day at five", "3h10m" |
Buffer
Like all filters, this filter treat only 1 event at a time. This can lead to some slowing down of the pipeline speed due to the network round-trip time, and high network I/O.
A buffer can be set to mitigate this.
Currently, there is only one basic “memory” buffer.
You can enable / disable use of buffer with the option use_cache.
Memory Buffer
This buffer store data fetched from the LDAP server in RAM, and can be configured with two parameters:
- cache_memory_duration: duration (in s) before a cache entry is refreshed if hit.
- cache_memory_size: number of tuple (identifier, attributes) that the buffer can contains.
Older cache values than your TTL will be removed from cache.
Persistant cache buffer
For the only buffer for now, you will be able to save it to disk periodically.
Some specificities :
- for the memory cache, TTL will be reset
Two parameters are required:
- disk_cache_filepath: path on disk of this backup
- disk_cache_schedule: schedule (every X time unit) of this backup. Please check here for the syntax of this parameter.
Filter translate
A general search and replace tool that uses a configured hash and/or a file to determine replacement values. Currently supported are YAML, JSON, and CSV files. Each dictionary item is a key value pair.
You can specify dictionary entries in one of two ways:
- The dictionary configuration item can contain a hash representing the mapping.
filter {
      translate {
        field => "[http_status]"
        destination => "[http_status_description]"
        dictionary => {
          "100" => "Continue"
          "101" => "Switching Protocols"
          "200" => "OK"
          "500" => "Server Error"
        }
        fallback => "I'm a teapot"
      }
    }
- An external file (readable by logstash) may be specified in the
dictionary_pathconfiguration item:
filter {
	translate {
		dictionary_path => "/etc/logstash/lists/instance_cpu.yml"
		field => "InstanceType"
		destination => "InstanceCPUCount"
		refresh_behaviour => "replace"
	}
}
Sample dictionary file:
"c4.4xlarge": "16"
"c5.xlarge": "4"
"m1.medium": "1"
"m3.large": "2"
"m3.medium": "1"
"m4.2xlarge": "8"
"m4.large": "2"
"m4.xlarge": "4"
"m5a.xlarge": "4"
"m5d.xlarge": "4"
"m5.large": "2"
"m5.xlarge": "4"
"r3.2xlarge": "8"
"r3.xlarge": "4"
"r4.xlarge": "4"
"r5.2xlarge": "8"
"r5.xlarge": "4"
"t2.large": "2"
"t2.medium": "2"
"t2.micro": "1"
"t2.nano": "1"
"t2.small": "1"
"t2.xlarge": "4"
"t3.medium": "2"
External API
A simple filter that checks if an IP (from PublicIpAddress field) address exists in an external system. The result is written to the op5exists field. Then, using a grok filter, the number of occurrences is decoded and put into the op5count field.
ruby {
	code => '
		checkip = event.get("PublicIpAddress")
		output=`curl -s -k -u monitor:monitor "https://192.168.1.1/api/filter/count?query=%5Bhosts%5D%28address%20~~%20%22#	{checkip}%22%20%29" 2>&1`
		event.set("op5exists", "#{output}")
	'
}
grok {
	match => { "op5exists" => [ ".*\:%{NUMBER:op5count}" ] }
}
Logstash - Output to Elasticsearch
This output plugin sends all data to the local Elasticsearch instance and create indexes:
output {
	elasticsearch {
	   hosts => [ "127.0.0.1:9200" ]

	   index => "%{type}-%{+YYYY.MM.dd}"

	   user => "logstash"
	   password => "logstash"
	}
}
Logstash plugin for “naemon beat”
This Logstash plugin has example of complete configuration for integration with naemon application:
input {
    beats {
        port => FILEBEAT_PORT
        type => "naemon"
    }
}

filter {
    if [type] == "naemon" {
        grok {
            patterns_dir => [ "/etc/logstash/patterns" ]
            match => { "message" => "%{NAEMONLOGLINE}" }
            remove_field => [ "message" ]
        }
        date {
            match => [ "naemon_epoch", "UNIX" ]
            target => "@timestamp"
            remove_field => [ "naemon_epoch" ]
        }
    }
}

output {
    # Single index
#    if [type] == "naemon" {
#        elasticsearch {
#            hosts => ["ELASTICSEARCH_HOST:ES_PORT"]
#            index => "naemon-%{+YYYY.MM.dd}"
#        }
#    }

    # Separate indexes
    if [type] == "naemon" {
        if "_grokparsefailure" in [tags] {
            elasticsearch {
                hosts => ["ELASTICSEARCH_HOST:ES_PORT"]
                index => "naemongrokfailure"
            }
        }
        else {
            elasticsearch {
                hosts => ["ELASTICSEARCH_HOST:ES_PORT"]
                index => "naemon-%{+YYYY.MM.dd}"
            }
        }
    }
}
Logstash plugin for “perflog”
This Logstash plugin has example of complete configuration for integration with perflog:
input {
  tcp {
    port => 6868
    host => "0.0.0.0"
    type => "perflogs"
  }
}

filter {
  if [type] == "perflogs" {
    grok {
      break_on_match => "true"
      match => {
        "message" => [
          "DATATYPE::%{WORD:datatype}\tTIMET::%{NUMBER:timestamp}\tHOSTNAME::%{DATA:hostname}\tSERVICEDESC::%{DATA:servicedescription}\tSERVICEPERFDATA::%{DATA:performance}\tSERVICECHECKCOMMAND::.*?HOSTSTATE::%{WORD:hoststate}\tHOSTSTATETYPE::.*?SERVICESTATE::%{WORD:servicestate}\tSERVICESTATETYPE::%{WORD:servicestatetype}",
          "DATATYPE::%{WORD:datatype}\tTIMET::%{NUMBER:timestamp}\tHOSTNAME::%{DATA:hostname}\tHOSTPERFDATA::%{DATA:performance}\tHOSTCHECKCOMMAND::.*?HOSTSTATE::%{WORD:hoststate}\tHOSTSTATETYPE::%{WORD:hoststatetype}"
          ]
        }
      remove_field => [ "message" ]
    }
    kv {
      source => "performance"
      field_split => "\t"
      remove_char_key => "\.\'"
      trim_key => " "
      target => "perf_data"
      remove_field => [ "performance" ]
      allow_duplicate_values => "false"
      transform_key => "lowercase"
    }
    date {
      match => [ "timestamp", "UNIX" ]
      target => "@timestamp"
      remove_field => [ "timestamp" ]
    }
  }
}

output {
  if [type] == "perflogs" {
    elasticsearch {
      hosts => ["127.0.0.1:9200"]
      index => "perflogs-%{+YYYY.MM.dd}"
    }
  }
}
Single password in all Logstash outputs
You can set passwords and other Logstash pipeline settings as environment variables. This can be useful if the password was changed for the logastash user and it must be to update in the configuration files.
Configuration steps:
Create the service file:
mkdir –p /etc/systemd/system/logstash.service.d vi /etc/systemd/system/logstash.service.d/logstash.conf
 	[Service]
 	Environment="ELASTICSEARCH_ES_USER=logserver"
 	Environment="ELASTICSEARCH_ES_PASSWD=logserver"
Reload systemctl daemon:
systemctl daemon-reload
Sample definition of Logstash output pipline seciotn:
 output  {
   elasticsearch {
     index => "test-%{+YYYY.MM.dd}"
     user => "${ELASTICSEARCH_ES_USER:elastic}"
     password => "${ELASTICSEARCH_ES_PASSWD:changeme}"
   }
 }
Cerebro - elasticsearch web admin tool
Cerebro is the Elasticsearch administration tool that allows you to perform the following tasks:
- monitoring and management of indexing nodes, indexes and shards:
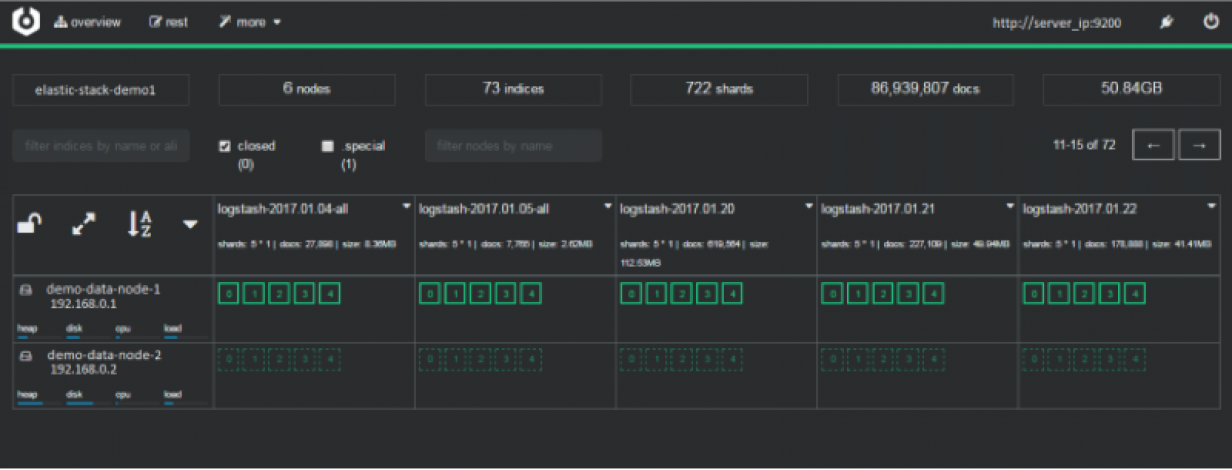
- monitoring and management of index shapshoots :
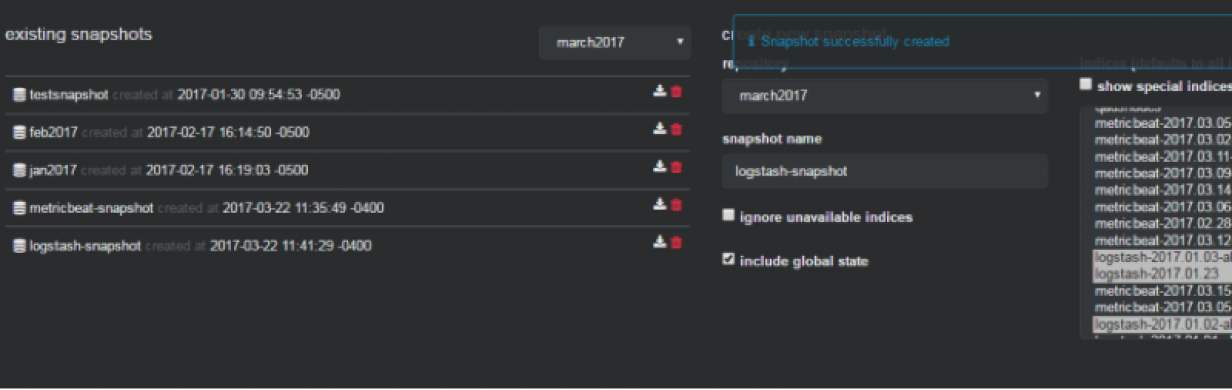
- informing about problems with indexes and shards:
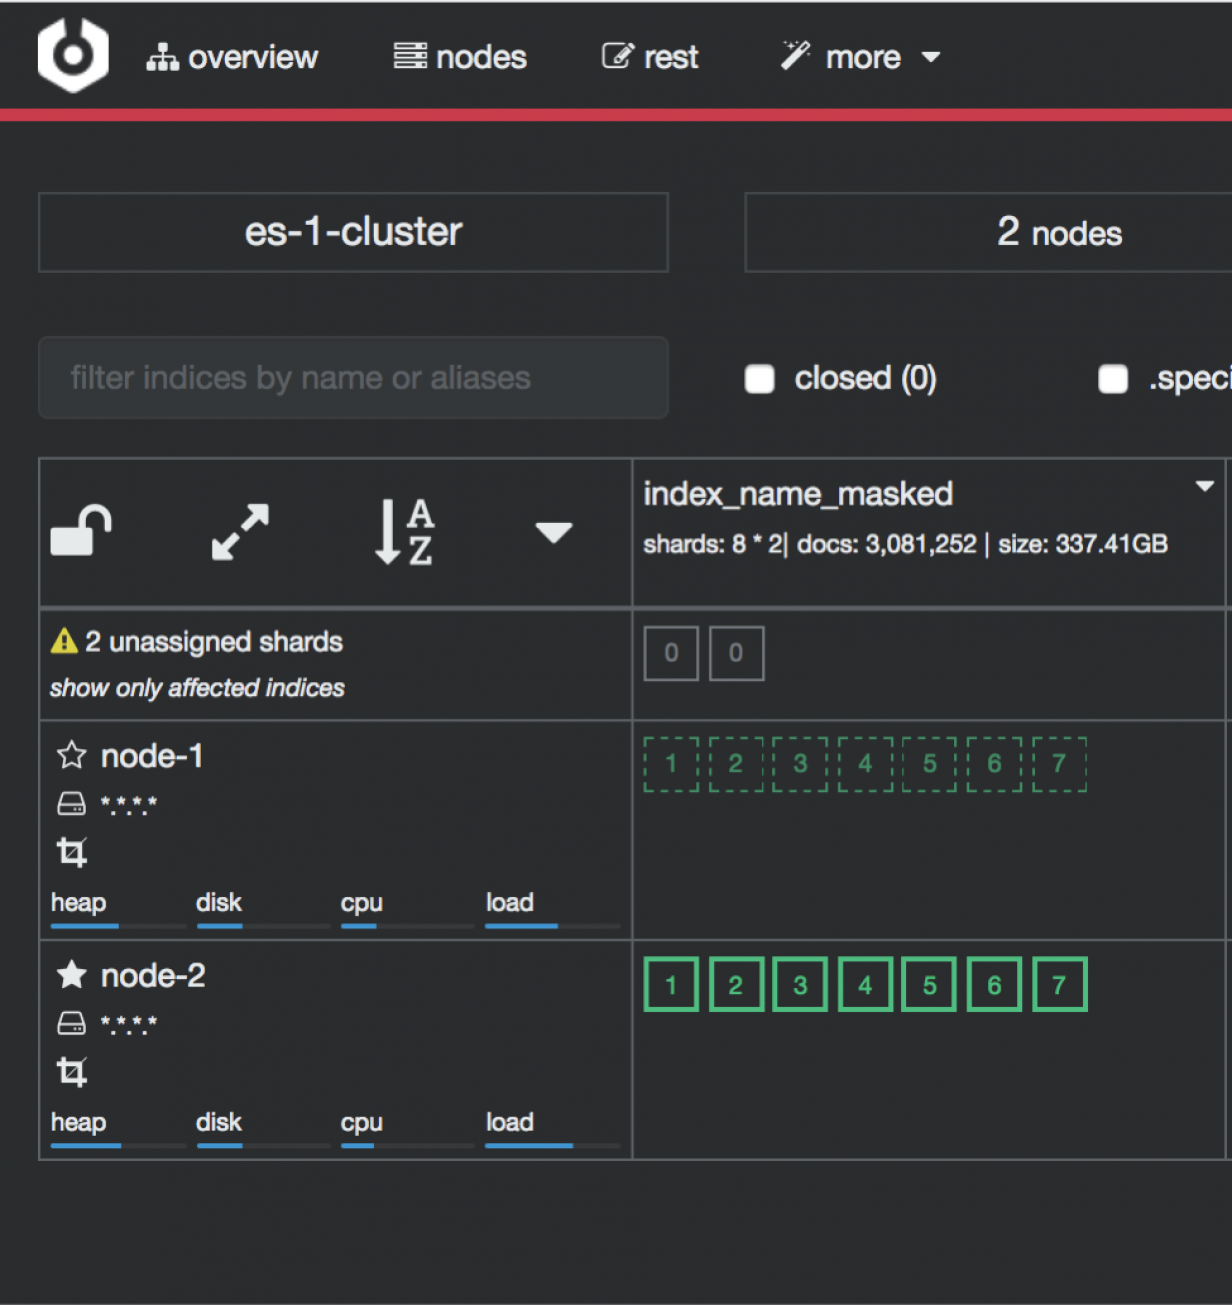
To configure cerebro see to Configuration section.
Integration ITRS Log Analytics with AWS service
The scope of integration
The integration of ITRS Log Analytics with the AWS cloud environment was prepared based on the following requirements:
- General information of the EC2 area, i.e .:
- number of machines
- number of CPUs
- amount of RAM
- General information of the RDS area, i.e.:
- Number of RDS instances
- The number of RDS CPUs
- Amount of RDS RAM
- EC2 area information containing information for each machine i.e .:
- list of tags;
- cloudwatch alarms configured;
- basic information (e.g. imageID, reservtionid, accountid, launch date, private and public address, last backup, etc.);
- list of available metrics in cloudwatch;
- list of snapshots;
- AMI list;
- cloudtrail (all records, with detailed details).
- Information on Backups of EC2 and RDS instances
- Search for S3 objects, shoes, AMI images
- Downloading additional information about other resources, ie IG, NAT Gateway, Transit Gateway.
- Monitoring changes in the infrastructure based on Cloudtrail logs;
- Monitoring costs based on billing and usage reports.
- Monitoring the Security Group and resources connected to them and resources not connected to the Security Group
- Monitoring user activity and inactivity.
- Integration supports service for multiple member accounts in AWS organization
The integration uses a Data Collector, i.e. the ITRS Log Analytics host, which is responsible for receiving data from external sources.
Data download mechanism
The integration was prepared based on AWS (CLI), a unified tool for managing AWS services, with which it is possible to download and monitor many AWS services from the command line. The AWS (CLI) tool is controlled by the ITRS Log Analytics data collector, which execute commands at specified intervals and captures the results of data received from the AWS service. The obtained data is processed and enriched and, as a result, saved to the ITRS Log Analytics indexes.
AWS Cost & Usage Report
The integration of ITRS Log Analytics with the AWS billing environment requires access to AWS Cost & Usage reports, which generated in accordance with the agreed schedule constitute the basic source of data for cost analysis in ITRS Log Analytics. The generated report is stored on S3 in the bucket defined for this purpose and cyclically downloaded from it by the ITRS Log Analytics collector. After the report is downloaded, it is processed and saved to a dedicated Elasticsearch index. The configuration of generating and saving a report to S3 is described in the AWS documentation: https://aws.amazon.com/aws-cost-management/aws-cost-and-usage-reporting/.
Cloud Trail
The integration of the ITRS Log Analytics with the AWS environment in order to receive events from the AWS environment requires access to the S3 bucket, on which the so-called AWS Trails. The operation of the ITRS Log Analytics collector is based on periodical checking of the “cloudtraillogs” bucket and downloading new events from it. After the events are retrieved, they are processed so that the date the event occurred matches the date the document was indexed. The AWS Trail creation configuration is described in the AWS documentation: https://docs.aws.amazon.com/awscloudtrail/latest/userguide/cloudtrail-create-a-trail-using-the-console-first-time.html#creating-a-trail-in-the-console.
Configuration
Configuration of access to the AWS account
Configuration of access to AWS is in the configuration file of the AWS service (CLI), which was placed in the home directory of the Logstash user:
/home/logstash/.aws/config
 [default]
aws_access_key_id=A************************4
aws_secret_access_key=*******************************************u
The “default” section contains aws_access_key_id and aws_secret_access_key. Configuration file containing the list of AWS accounts that are included in the integration:
/etc/logstash/lists/account.txt
Configuration of AWS profiles
AWS profiles allow you to navigate to different AWS accounts using the defined AWS role for example : “LogserverReadOnly”. Profiles are defined in the configuration file:
/home/logstash/.aws/config
Profile configuration example:
[profile 111111111222]
role_arn = arn: aws: iam :: 111111111222: role / LogserverReadOnly
source_profile = default
region = eu-west-1
output = json
The above section includes
- profile name;
- role_arn - definition of the account and the role assigned to the account;
- source_profile - definition of the source profile;
- region - AWS region;
- output - the default format of the output data.
Configure S3 buckets scanning
The configuration of scanning buckets and S3 objects for the “s3” dashboard was placed in the following configuration files:
- /etc/logstash/lists/bucket_s3.txt - configuration of buckets that are included in the scan;
- /etc/logstash/lists/account_s3.txt - configuration of accounts that are included in the scan;
Configuration of AWS Cost & Usage reports
Downloading AWS Cost & Usage reports is done using the script: “/etc/logstash/lists/bin/aws_get_billing.sh”
In which the following parameters should be set:
- BUCKET = bucket_bame - bucket containing packed rarpotes;
- PROFILE = profile_name - a profile authorized to download reports from the bucket.
Logstash Pipelines
Integration mechanisms are managed by the Logstash process, which is responsible for executing scripts, querying AWS, receiving data, reading data from files, processing the received data and enriching it and, as a result, submitting it to the ITRS Log Analytics index. These processes were set up under the following Logstash pipelines:
- pipeline.id: aws
  path.config: "/etc/logstash/aws/conf.d/*.conf"
  pipeline.workers: 1

- pipeline.id: awstrails
  path.config: "/etc/logstash/awstrails/conf.d/*.conf"
  pipeline.workers: 1

- pipeline.id: awss3
  path.config: "/etc/logstash/awss3/conf.d/*.conf"
  pipeline.workers: 1

- pipeline.id: awsbilling
  path.config: "/etc/logstash/awsbilling/conf.d/*.conf"
  pipeline.workers: 1
Configuration of AWS permissions and access
To enable the correct implementation of the integration assumptions in the configuration of the IAM area, an Logserver-ReadOnly account was created with programming access with the following policies assigned:
{
    "Version": "2012-10-17",
    "Statement": [
        {
            "Effect": "Allow",
            "Action": [
                "backup:Describe*",
                "backup:Get*",
                "backup:List*",
                "cloudwatch:Describe*",
                "cloudwatch:Get*",
                "cloudwatch:List*",
                "ec2:Describe*",
                "iam:GenerateCredentialReport",
                "iam:GetCredentialReport",
                "logs:Describe*",
                "logs:Get*",
                "rds:Describe*",
                "rds:List*",
                "tag:Get*"
            ],
            "Resource": "*"
        },
        {
            "Sid": "AllowSpecificS3ForLogServer",
            "Effect": "Allow",
            "Action": [
                "s3:Get*",
                "s3:List*"
            ],
            "Resource": [
                "arn:aws:s3:::veoliaplcloudtraillogs",
                "arn:aws:s3:::veoliaplcloudtraillogs/*"
            ]
        }
    ]
}
Data indexing
The data in the indexes has been divided into the following types:
- awscli-* - storing volumetric data about AWS infrastructure;
- awsbilling-* - storing billing data from billing reports;
- awscli-trail-* - storing AWS environment events / logs from CloudTrail;
- awsusers-000001 - storing data about users and administrators of the AWS service.
Dashboards
The data collected in the integration process has been visualized and divided into the following sections (dashboards):
- Overview - The section provides an overview of the quantitative state of the environment
- EC2 - the section contains details about the EC2 instance;
- RDS - the section contains details about RDS instances;
- AMI - the section contains details about Images;
- S3 - section for searching for objects and buckets S3;
- Snapshots - section for reviewing snapshots taken;
- Backups - section to review the backups made;
- CloudTrail - a section for analyzing logs downloaded from CloudTrail;
- IAM - a section containing user and administrator activity and configuration of AWS environment access accounts;
- Billing - AWS service billing section;
- Gateways - section containing details and configuration of AWS Gateways.
Overview
The following views are included in the “Overview” section:
- [AWS] Navigation - navigation between sections;
- [AWS] Overview Selector - active selector used to filter sections;
- [AWS] Total Instances - metric indicator of the number of EC2 instances;
- [AWS] Total CPU Running Instances - metric indicator of the number of CPUs running EC2 instances;
- [AWS] Total Memory Running Instances - metric indicator of RAM [MB] amount of running EC2 instances;
- [AWS] Total RDS Instances - metric indicator of the number of RDS instances;
- [AWS] Total CPU Running RDS - metric indicator of the number of CPUs running RDS instances;
- [AWS] Total Memory Running RDS - metric indicator of the amount of RAM [GB] of running RDS instances;
- [AWS] Instance List - an array containing aggregated details about an EC2 instance;
- [AWS] RDS Instance List - an array containing aggregated details about an EC2 instance;
- [AWS] Alarm List - table containing the list of AWS environment alarms;
- [AWS] Tags List - an array containing a list of AWS tags;
- [AWS] CloudWatch Metrics - table containing a list of AWS metrics;
EC2
The following views have been placed in the “EC2” section:
- [AWS] Navigation - navigation between sections;
- [AWS] State Selector - active selector used to filter sections;
- [AWS] Total Instances - metric indicator of the number of EC2 instances;
- [AWS] Total CPU Running Instances - metric indicator of the number of CPUs running EC2 instances;
- [AWS] Running histogram - graphical interpretation of the instance status in the timeline;
- [AWS] Total Memory Running Instances - metric indicator of RAM [MB] amount of running EC2 instances;
- [AWS] OP5 Monitored Count - metric indicator of monitored instances in the OP5 Monitor system;
- [AWS] OP5 NOT Monitored Count - metric indicator of unmonitored instances in the OP5 Monitor system;
- [AWS] OP5 Monitored Details - a table containing a list of instances with monitoring details in the OP5 Monitoring system;
- [AWS] Instance Details List - table containing details of the EC2 instance;
- [AWS] CloudWatch Metrics - table containing details of EC2 metrics downloaded from AWS service;
RDS
The following views have been placed in the “RDS” section:
- [AWS] Navigation - navigation between sections;
- [AWS] RDS State Selector - active selector used for section filtering;
- [AWS] Total RDS Instances - metric indicator of the number of RDS instances;
- [AWS] Total CPU Running RDS - metric indicator of the number of CPUs running RDS instances;
- [AWS] RDS Running histogram - graphical interpretation of the instance status in the timeline;
- [AWS] RDS Instance Details - a table containing aggregated details of a RDS instance;
- [AWS] RDS Details - table containing full details of the RDS instance;
- [AWS] CloudWatch Metrics - table containing details of EC2 metrics downloaded from AWS service;
AMI
The following views have been placed in the “AMI” section:
- [AWS] Navigation - navigation between sections;
- [AWS] Image Selector - active selector used to filter sections;
- [AWS] Image Details - a table containing full details of the images taken;
- [AWS] Image by Admin Details - a table containing full details of images made by the administrator;
- [AWS] AMI type by time - graphical interpretation of image creation presented in time;
Security
The following views have been placed in the “Security” section:
- [AWS] Navigation - navigation between sections;
- [AWS] Security Selector - active selector used to filter sections;
- [AWS] Security Group ID by InstanceID - a table containing Security Groups with assigned Instances;
- [AWS] Instance by Security Group - a table containing Instances with assigned Security Groups and details;
- [AWS] Security Group connect state - table containing the status of connecting the Security Groups to the EC2 and RDS instances.
Snapshots
The following views have been placed in the “Snapshots” section:
- [AWS] Navigation - navigation between sections;
- [AWS] Snapshot Selector - active selector used to filter sections;
- [AWS] Snapshots List - a view containing a list of snapshots made with details;
- [AWS] Snapshots by time - graphical interpretation of creating snapshots over time;
Backups
The following views have been placed in the “Backup” section:
- [AWS] Navigation - navigation between sections;
- [AWS] Backup Selector - active selector used to filter sections;
- [AWS] Backup List - view containing the list of completed Backup with details;
- [AWS] Backup by time - graphical interpretation of backups presented in time;
CloudTrail
The following views have been placed in the “CloudTrail” section:
- [AWS] Navigation - navigation between sections;
- [AWS] Event Selector - active selector used to filter sections;
- [AWS] Events Name Activity - event activity table with event details;
- [AWS] CloudTrail - graphical interpretation of generating events in the AWS service presented over time;
IAM
The following views have been placed in the “IAM” section:
- [AWS] Navigation - navigation between sections;
- [AWS] IAM Selector - active selector used to filter sections;
- [AWS] IAM Details - the table contains AWS service users, configured login methods, account creation time and account assignment;
- [AWS] User last login - user activity table containing the period from the last login depending on the login method;
Gateways
The following views have been placed in the Gateways section:
- [AWS] Navigation - navigation between sections;
- [AWS] Gateways Selector - active selector used to filter sections;
- [AWS] Internet Gateway - details table of configured AWS Internet Gateways;
- [AWS] Transit Gateways - details table of configured AWS Transit Gateways;
- [AWS] Nat Gateway - details table of configured AWS Nat Gateways;