User and Entity Behaviour Analytics (UEBA)
The User and Entity Behaviour Analytics (UEBA) module introduces a new approach to securing an organisation’s infrastructure and its employees. Machine learning algorithms, based on data provided by the UEBA Engine, learn the behaviour patterns of individual employees and can identify anomalies. The UEBA Engine aggregates events occurring on devices used by employees. The results of the analysis are visualised on the UEBA Dashboards.
Events
The Events tab in the UEBA Dashboard presents data received from the UEBA Engine, visualised in a clear and structured way. To enhance analytical accuracy, there is the capability to filter data by specific User, Computer name, Event, and Source of the data.
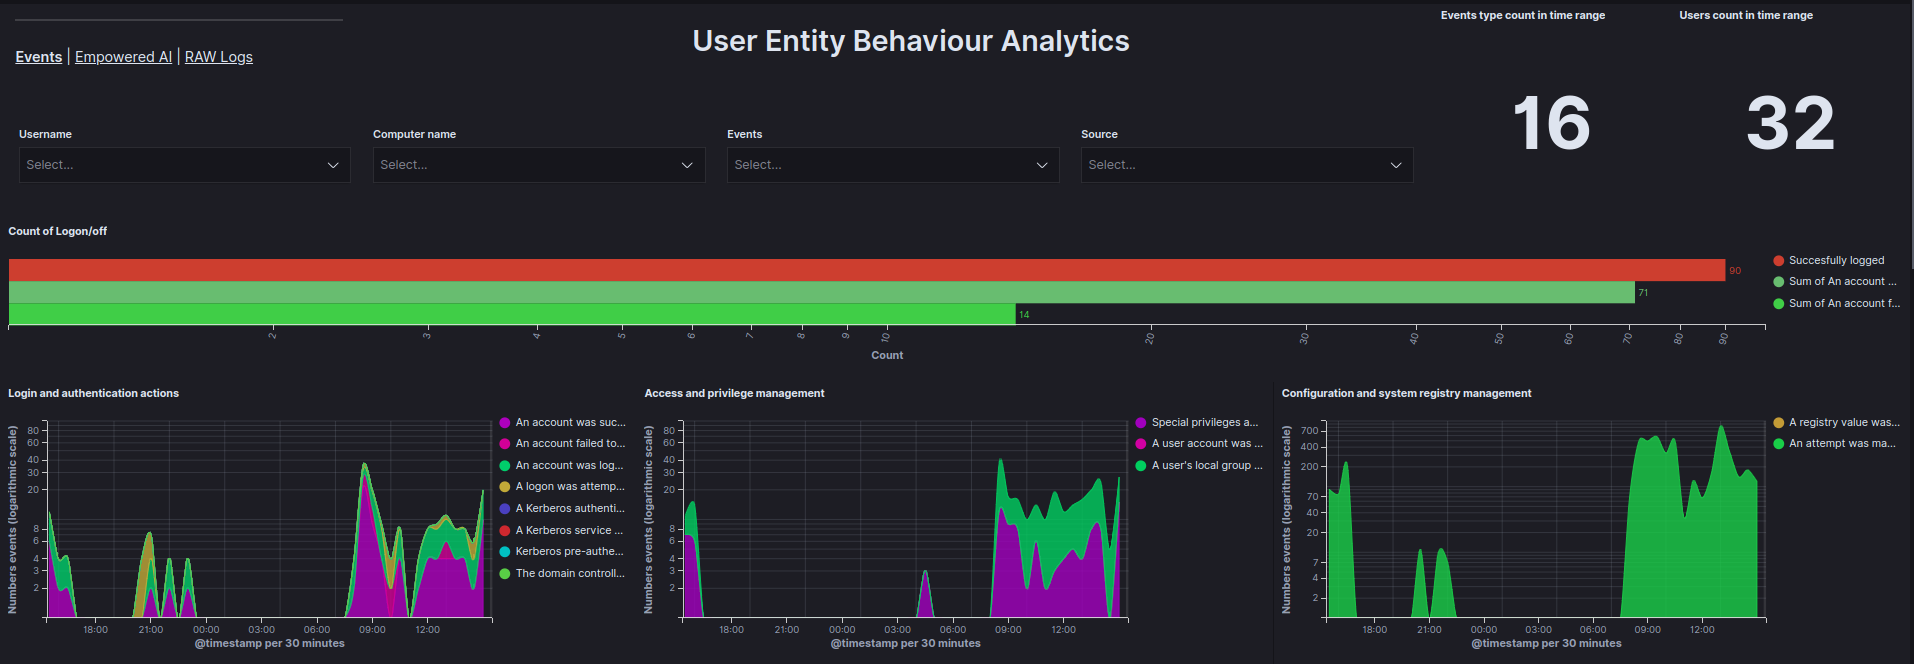 Events tab
Data is visualised using the following graphs:
- Count of Logon/off - Total count of
Logon,Logoff, andFailed to Logonevents within a specified time range. - Login and authentication actions - Count of login and authentication events as a function of time.
- Access and privilege management - Count of access and privilege management events as a function of time.
- Configuration and system registry management - Count of configuration and system registry management events as a function of time.
- Service and process management - Count of service and process management events as a function of time.
- Management of facilities and access to resources - Count of facility management and access-to-resource events as a function of time.
- Account and group management - Count of account and group management events as a function of time.
- Top 10 reported events - Ranking of the most frequently occurring events.
- Top users by document count graph - Ranking of users generating the most documents.
- Top 5 users by document count - Table showing the top 5 users generating the most documents.
- Event actions - Number of actions for each event based on the user.
- Matrix User - Computer Name - A matrix showing which users are using which devices.
Empowered AI
The Empowered AI tab provides visualisations of AI analysis results.
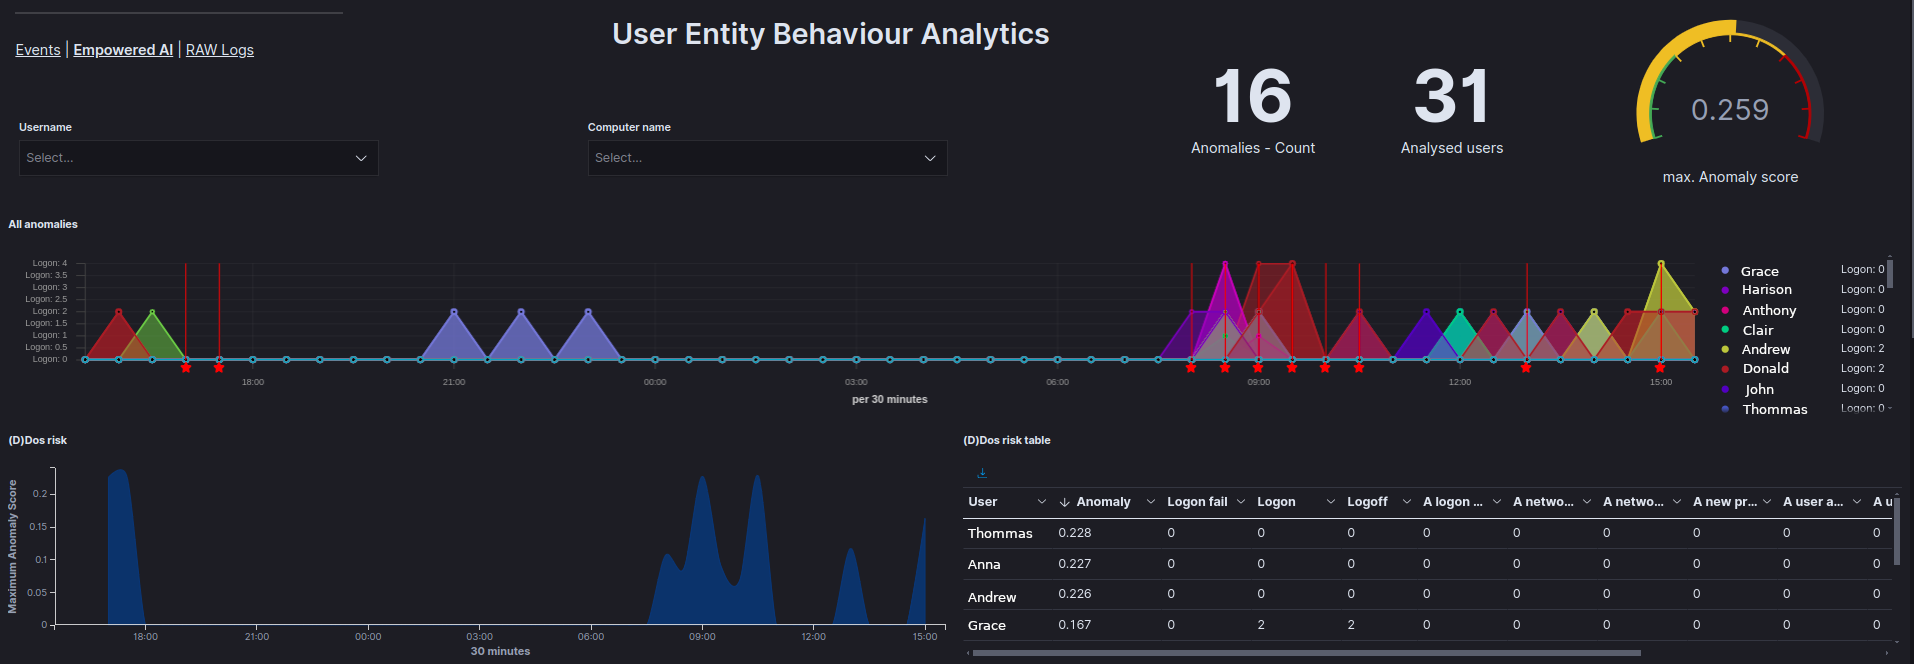 Empowered-AI tab
Each case is presented with the following graphs:
- All anomalies - Displays all anomalies on a timeline.
- (D)DoS risk - Shows the results of analyses checking whether a (D)DoS attack has occurred.
- (D)DoS risk table - Displays the results of the analysis for each user in the
Anomaly_scorefield and allows for the review of values for each field analysed. - APT risk - Displays the results of analyses checking for potential APT attacks.
- APT risk table - Displays the results of the analysis for each user in the
Anomaly_scorefield and allows for the review of values for each field analysed. - Ransomware risk - Displays the results of analyses checking for potential ransomware attacks.
- Ransomware risk table - Displays the results of the analysis for each user in the
Anomaly_scorefield and allows for the review of values for each field analysed. - All events anomaly - Displays the results of analyses for all fields provided by the UEBA Engine to identify abnormal user behaviour.
- All events anomaly table - Displays the results of the analysis for each user in the
Anomaly_scorefield and allows for the review of values for each field analysed. - Service installation anomalies - Displays the results of analyses related to service installation anomalies.
- Logon anomalies - Displays the results of analyses related to
Logon,Logoff, andFailed to Logonevents. - Affected users table - Displays the highest and average
Anomaly_scorefor each user and the type of analysis in which that score occurred. - Affected users - Shows a pie chart highlighting the users most affected by anomalies.
Raw Logs
The Raw Logs tab displays the basic information provided by the UEBA Engine in an organised table. It is possible to verify which specific event occurred at what time, for which user, and on which device.
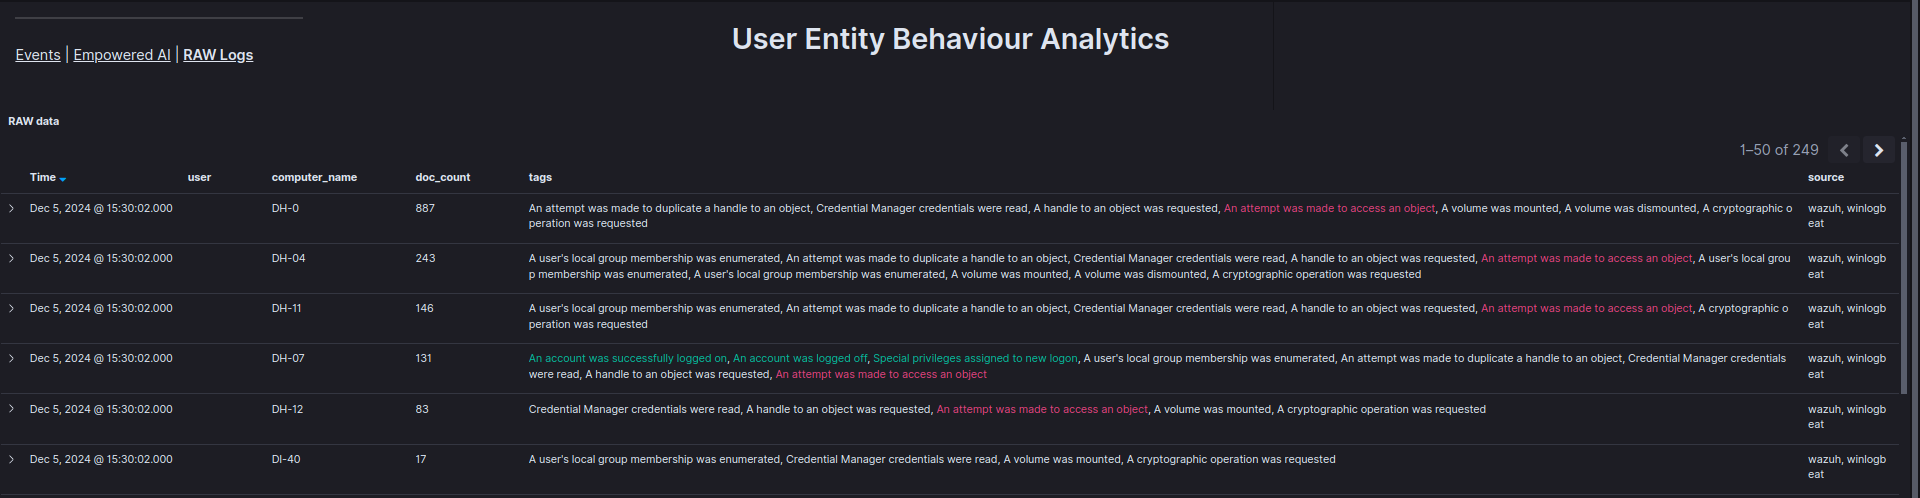 Raw Logs tab