Configuration
Plugins Management
GUI
Base installation of the ITRS Log Analytics contains the Agents, Alerts, Archive, Automation, CMDB, Index Management, Intelligence, Network Probe, Reports, SQL plugins - These add-ons can be disabled or enabled via the configuration file without having to install or uninstall. You can extend the basic GUI functionality by installing custom plugins.
After installation, each node must be restarted before the plugin becomes visible.
The Logserver GUI provides three categories of plugins:
- Licenced Plugins - ITRS Log Analytics
- Core Plugins - it is plugins that are part of the core project.
- Community-contributed - it is plugins that are external to the core project
Enabling/Disabling Plugins
Managing the Agents Plugin:
- Disable:
- Add
agents.enabled: falseto the file/etc/logserver-gui/logserver-gui.yml. - Run the command systemctl restart.
- Add
- Enable:
- Remove or comment out the line
agents.enabled: falsein the file/etc/logserver-gui/logserver-gui.yml. - Run the command systemctl restart.
- Remove or comment out the line
Managing the Alerts Plugin:
- Disable:
- Change
alerts.enabled: truetoalerts.enabled: falsein the file/etc/logserver-gui/logserver-gui.yml. - Run the command systemctl restart.
- Change
- Enable:
- Change
alerts.enabled: falsetoalerts.enabled: truein the file/etc/logserver-gui/logserver-gui.yml. - Run the command systemctl restart.
- Change
Managing the Archive Plugin:
- Disable:
- Add
archive.enabled: falseto the file/etc/logserver-gui/logserver-gui.yml. - Run the command systemctl restart.
- Add
- Enable:
- Remove or comment out the line
archive.enabled: falsein the file/etc/logserver-gui/logserver-gui.yml. - Run the command systemctl restart.
- Remove or comment out the line
Managing the Automation Plugin:
- Disable:
- Change
automation.enabled: truetoautomation.enabled: falsein the file/etc/logserver-gui/logserver-gui.yml. - Run the command systemctl restart.
- Change
- Enable:
- Change
automation.enabled: falsetoautomation.enabled: truein the file/etc/logserver-gui/logserver-gui.yml. - Run the command systemctl restart.
- Change
Managing the CMDB Plugin:
- Disable:
- Add
cmdb.enabled: falseto the file/etc/logserver-gui/logserver-gui.yml. - Run the command systemctl restart.
- Add
- Enable:
- Remove or comment out the line
cmdb.enabled: falsein the file/etc/logserver-gui/logserver-gui.yml. - Run the command systemctl restart.
- Remove or comment out the line
Managing the Console Plugin:
- Disable:
- Change
console.enabled: truetoconsole.enabled: falsein the file/etc/logserver-gui/logserver-gui.yml. - Run the command systemctl restart.
- Change
- Enable:
- Change
console.enabled: falsetoconsole.enabled: truein the file/etc/logserver-gui/logserver-gui.yml. - Run the command systemctl restart.
- Change
Managing the Index Management Plugin:
- Disable:
- Add
index_management.enabled: falseto the file/etc/logserver-gui/logserver-gui.yml. - Run the command systemctl restart.
- Add
- Enable:
- Remove or comment out the line
index_management.enabled: falsein the file/etc/logserver-gui/logserver-gui.yml. - Run the command systemctl restart.
- Remove or comment out the line
Managing the Intelligence Plugin:
- Disable:
- Add
intelligence.enabled: falseto the file/etc/logserver-gui/logserver-gui.yml. - Run the command systemctl restart.
- Add
- Enable:
- Remove or comment out the line
intelligence.enabled: falsein the file/etc/logserver-gui/logserver-gui.yml. - Run the command systemctl restart.
- Remove or comment out the line
Managing the Network Probe Plugin:
- Disable:
- Add
network-probe.enabled: falseto the file/etc/logserver-gui/logserver-gui.yml. - Run the command systemctl restart.
- Add
- Enable:
- Remove or comment out the line
network-probe.enabled: falsein the file/etc/logserver-gui/logserver-gui.yml. - Run the command systemctl restart.
- Remove or comment out the line
Managing the Reports Plugin:
- Disable:
- Add
reports.enabled: falseto the file/etc/logserver-gui/logserver-gui.yml. - Run the command systemctl restart.
- Add
- Enable:
- Remove or comment out the line
reports.enabled: falsein the file/etc/logserver-gui/logserver-gui.yml. - Run the command systemctl restart.
- Remove or comment out the line
Managing the vis_type_timeline Plugin:
- Disable:
- Change
vis_type_timeline.enabled: truetovis_type_timeline.enabled: falsein the file/etc/logserver-gui/logserver-gui.yml. - Run the command systemctl restart.
- Change
- Enable:
- Change
vis_type_timeline.enabled: falsetovis_type_timeline.enabled: truein the file/etc/logserver-gui/logserver-gui.yml. - Run the command systemctl restart.
- Change
Managing the XLSX Import Plugin:
- Disable:
- Add
xlsx_import.enabled: falseto the file/etc/logserver-gui/logserver-gui.yml. - Run the command systemctl restart.
- Add
- Enable:
- Remove or comment out the line
xlsx_import.enabled: falsein the file/etc/logserver-gui/logserver-gui.yml. - Run the command systemctl restart.
- Remove or comment out the line
Managing the SQL Plugin:
- Disable:
- Add
sql.enabled: falseto the file/etc/logserver-gui/logserver-gui.yml. - Run the command systemctl restart.
- Add
- Enable:
- Remove or comment out the line
sql.enabled: falsein the file/etc/logserver-gui/logserver-gui.yml. - Run the command systemctl restart.
- Remove or comment out the line
Installing Plugins
Additional GUI plugins can be installed as follows:
 cd /usr/share/logserver-gui/
 bin/logserver-gui-plugin install [plugin_name]
Examples: Plugins from a custom link or filesystem can be installed as follows:
 bin/logserver-gui-plugin install file:///path/to/plugin.zip
 bin/logserver-gui-plugin install file:///C:/path/to/plugin.zip
 bin/logserver-gui-plugin install http://some.domain/path/to/plugin.zip
Removing plugins
bin/logserver-gui-plugin remove [pluginname]
Updating plugins
 bin/logserver-gui-plugin remove [pluginname]
 bin/logserver-gui-plugin install [pluginname]
Data Node
Base installation of the ITRS Log Analytics contains the logserver_auth, join, logserver_quard plugin - These add-ons can be disabled or enabled via the configuration file without having to install or uninstall. You can extend the basic Data Node functionality by installing custom plugins.
Plugins contain JAR files, but may also contain scripts and config files, and must be installed on every node in the cluster.
After installation, each node must be restarted before the plugin becomes visible.
The Data Node provides three categories of plugins:
- Licenced Plugins - ITRS Log Analytics
- Core Plugins - it is plugins that are part of the core project.
- Community-contributed - it is plugins that are external to the core project
Enabling/Disabling Plugins
Managing the logserver_auth Plugin:
- Disable:
- Add
plugins.logserver_auth.enabled: falseto the file/etc/logserver/logserver.yml. - Run the command systemctl restart.
- Add
- Enable:
- Remove or comment out the line
plugins.logserver_auth.enabled: falsein the file/etc/logserver/logserver.yml. - Run the command systemctl restart.
- Remove or comment out the line
Managing the logserver_guard Plugin:
- Disable:
- Add
logserverguard.ssl.transport.enabled: falseto the file/etc/logserver/logserver.yml. - Add
logserverguard.ssl.http.enabled: falseto the file/etc/logserver/logserver.yml. - Run the command systemctl restart.
- Add
- Enable:
- Remove or comment out the line
logserverguard.ssl.transport.enabled: falsein the file/etc/logserver/logserver.yml. - Remove or comment out the line
logserverguard.ssl.http.enabled: falsein the file/etc/logserver/logserver.yml. - Run the command systemctl restart .
- Remove or comment out the line
Managing the sql Plugin:
- Disable:
- Add
plugins.sql.enabled: falseto the file/etc/logserver/logserver.yml. - Run the command systemctl restart.
- Add
- Enable:
- Remove or comment out the line
plugins.sql.enabled: falsein the file/etc/logserver/logserver.yml. - Run the command systemctl restart.
- Remove or comment out the line
Installing Plugins
Additional Data Node plugins can be installed as follows:
 cd /usr/share/logserver/
 bin/logserver-plugin install [plugin_name]
Examples: Plugins from a custom link or filesystem can be installed as follows:
 bin/logserver-plugin install file:///path/to/plugin.zip
 bin/logserver-plugin install file:///C:/path/to/plugin.zip
 bin/logserver-plugin install <http://some.domain/path/to/plugin.zip>
Removing plugins
bin/logserver-plugin remove [pluginname]
Updating plugins
 bin/logserver-plugin remove [pluginname]
 bin/logserver-plugin install [pluginname]
Offline TLS Tool
The TLS Tool is a program that can be used for:
- Generating Root and Intermediate CA’s,
- Generating Node, Client, and Admin certificates,
- Generating CSRs,
- Validating certificates
Besides the actual certificates the tool also generated configuration snippets which you can directly copy and paste into your Data Node main .yml file.
General usage
The tls tool will read the node- and certificate configuration settings from a yaml file, and outputs the generated files in a configurable directory.
You can choose to create the Root CA and (optional) intermediate CAs with your node certificates in one go. Or you can create the Root and intermediate CA first, and generate node certificates as you need them.
You will find the script in:
<installation directory>/tlstool.sh
Command line options
| Name | Description |
|---|---|
| -c,--config | Relative or absolute path to the configuration file. Required. |
| -t,--target | Relative or absolute path to the output directory. Optional, default: out |
| -v,--verbose | Enable detailed output, default: false |
| -f,--force | Force certificate generation despite of validation errors. default: false |
| -o,--overwrite | Overwrite existing node-, client and admin certificates if they are already present. default: false |
| -p,--pem | Change certificate file extension from ".crt" to ".pem". default: false |
| -ca,--create-ca | Create new Root and Intermediate CAs |
| -crt,--create-cert | Create certificates using an existing or newly created local certificate authority |
Examples
<installation directory>/tlstool.sh -c config/tlsconfig.yml -ca -crt
Reads the configuration from config/tlsconfig.yml and generates the configured Root and intermediate CAs and the configured node, admin, and client certificates in one go. The generated files will be written to out.
<installation directory>/tlstool.sh -c config/tlsconfig.yml -ca
Reads the configuration from config/tlsconfig.yml and generates the configured Root and intermediate CAs only.
<installation directory>/tlstool.sh -c config/tlsconfig.yml -crt
Reads the configuration from config/tlsconfig.yml and generates node, admin, and client certificates only. The Root and (optional) intermediate CA certificates and keys need to be present in the output directory, and their filenames, keys and (optional) passwords have to be configured in tlsconfig.yml.
Root CA
To configure the Root CA for all certificates, add the following lines to your configuration file:
ca:
   root:
      dn: CN=root.ca.example.com,OU=CA,O=Example Com, Inc.,DC=example,DC=com
      keysize: 2048
      pkPassword: root-ca-password
      validityDays: 3650
      file: root-ca.crt
Generated files:
root-ca.crt- Root certificateroot-ca.key- Private key of the Root CAroot-ca.readme- Auto-generated passwords of the root and intermediate CAs
Options:
| Name | Description |
|---|---|
| dn | The complete Distinguished Name of the Root CA. If you have special characters in the DN, you need to quote them correctly. Mandatory. |
| keysize | The size of the private key. Default: 2048 |
| pkPassword | Password of the private key. One of: "none", "auto" or a self-chosen password. Default: auto |
| file | File name of the certificate, optional. Default: "root-ca" |
The pkPassword can be one of:
- none: The generated private key will be unencrypted
- auto: A random password is generated automatically. After the certificates have been generated, you can find the password in root-ca.readme file. To use these new passwords again, you must edit the tool config file and set the generated passwords there.
- other value: Values other than none or auto are used as password directly
Intermediate CA
In addition to the root CA you optionally also specify an intermediate CA. If an intermediate CA is configured, then the node, admin, and client certificates will be signed by the intermediate CA. If you do want to use an intermediate CA, remove the following section from the configuration. The certificates are then signed by the root CA directly.
ca:
   intermediate:
      dn: CN=signing.ca.example.com,OU=CA,O=Example Com, Inc.,DC=example,DC=com
      keysize: 2048
      validityDays: 3650
      pkPassword: intermediate-ca-password
      file: intermediate-ca.crt
Generated files:
intermediate-ca.crt- Intermediate certificateintermediate-ca.key- Private key of the intermediate certificateroot-ca.readme- Auto-generated passwords of the root and intermediate CAs
Node and Client certificates
Global and default settings
The default settings are applied to all generated certificates and configuration snippets. All values here are optional.
defaults:
  validityDays: 730
  pkPassword: auto
  generatedPasswordLength: 12
  nodesDn:
    - "CN=*.example.com,OU=Ops,O=Example Com, Inc.,DC=example,DC=com"
  nodeOid: "1.2.3.4.5.5"
  httpsEnabled: true
  reuseTransportCertificatesForHttp: false
Options:
| Name | Description |
|---|---|
| validityDays | Validity of the generated certificates, in days. Default: 730. Can be overwritten for each certificate separately. |
| pkPassword | Password of the private key. One of: "none", "auto" or a self-chosen password. Default: auto. Can be overwritten for each certificate separately. |
| generatedPasswordLength | Length of the auto-generated password for the private keys. Only takes effect when pkPassword is set to auto. Default: 12. Can be overwritten for each certificate separately. |
| httpsEnabled | Whether to enable TLS on the REST layer or not. Default: true |
| reuseTransportCertificatesForHttp | If set to false, individual certificates for REST and Transport are generated. If set to true, the node certificates are also used on the REST layer. Default: false |
| verifyHostnames | Set this to true to enable hostname verification. Default: false |
| resolveHostnames | Set this to true to resolve hostnames against DNS. Default: false |
| signatureAlgorithm | Signature algorithm (for RSA default is SHA256withRSA, for EC its SHA256withECDSA) |
| useEllipticCurves | If set to true use elliptic curves instead of RSA. Default is false (since 1.7) |
| ellipticCurve | The curve to be used. Default is: NIST P-384 (since 1.7) |
Node certificates
To generate node certificates, add the node name, the Distinguished Name, the hostname(s), and/or the IP address(es) in the nodes section:
nodes:
  - name: node1
    dn: CN=test.example.com,OU=Dev,O=EMCA Software,C=Poland
    dns: test.example.com
    ip: 10.0.2.1
  - name: node2
    dn: CN=node2.example.com,OU=Dev,O=EMCA Software,C=Poland
    dns:
      - node2.example.com
      - es2.example.com
    ip:
      - 10.0.2.1
      - 192.168.2.1
  - name: node3
    dn: CN=node3.example.com,OU=Dev,O=EMCA Software,C=Poland
    dns: node3.example.com
Generated files:
[nodename].crt- Node certificate[nodename].key- Private key of the node certificate[nodename]_http.crt- REST certificate, only generated if reuseTransportCertificatesForHttp is false[nodename]_logserver_config_snippet.yml- Logserver Guard configuration snippet for this node, add this to logserver.yml
Options:
| Name | Description |
|---|---|
| name | Name of the node, will become part of the filenames. Mandatory |
| dn | The Distinguished Name of the certificate. If you have special characters in the DN, you need to quote them correctly. Mandatory |
| dns | The hostname(s) this certificate is valid for. Should match the hostname of the node. Optional, but recommended. |
| ip | The IP(s) this certificate is valid for. Optional. Prefer hostnames if possible. |
Admin and client certificates
To generate admin and client certificates, add the following lines to the configuration file:
clients:
  - name: spock
    dn: CN=spock.example.com,OU=Dev,O=EMCA Software,C=Poland
  - name: kirk
    dn: CN=kirk.example.com,OU=Dev,O=EMCA Software,C=Poland
    admin: true
Generated files:
[name].crt- Client certificate[name].key- Private key of the client certificateclient-certificates.readme- Contains the auto-generated passwords for the certificates
Options:
| Name | Description |
|---|---|
| name | Name of the certificate, will become part of the file name |
| dn | The complete Distinguished Name of the certificate. If you have special characters in the DN, you need to quote them correctly |
| admin | If set to true, this certificate will be marked as an admin certificate in the generated configuration snippet. |
Note that you need to mark at least one client certificate as an admin certificate.
Documentation link
To update the link that is inserted into the generated readme files:
documentationLink: "https://link-to-docs.com"
Options:
| Name | Description |
|---|---|
| documentationLink | Link to the site. Optional. |
Adding certificates after the first run
You can always add more node- or admin certificates as you need them after the initial run of the tool. As a precondition
- the root CA and, if used, the intermediate certificates and keys must be present in the output folder
- the password of the root CA and, if used, the intermediate CA must be present in the config file
If you use auto-generated passwords, copy them from the generated root-ca.readme file to the configuration file.
Certificates that have already been generated in a previous run of the tool will be left untouched unless you run the tool with the -o,--overwrite switch. In this case, existing files are overwritten. If you have chosen to auto-generate passwords, new keys with auto-generated passwords are created.
Creating CSRs
If you just want to create CSRs to submit them to your local CA, you can omit the CA part of the config complete. Just define the default, node, and client section, and run the TLS tool with the -csr switch.
Configuring ciphers for TLS settings
How to enable, disable and/or limit available ciphers for Logserver services.
Logserver Data Node
Edit config file /etc/logserver/logserver.yml.
Example:
logserverguard.ssl.transport.enabled_ciphers:
- TLS_AES_256_GCM_SHA384
- TLS_AES_128_GCM_SHA256
- TLS_CHACHA20_POLY1305_SHA256
- TLS_ECDHE_ECDSA_WITH_AES_256_GCM_SHA384
- TLS_ECDHE_RSA_WITH_AES_256_GCM_SHA384
- TLS_ECDHE_ECDSA_WITH_CHACHA20_POLY1305_SHA256
- TLS_ECDHE_RSA_WITH_CHACHA20_POLY1305_SHA256
- TLS_ECDHE_ECDSA_WITH_AES_128_GCM_SHA256
- TLS_ECDHE_RSA_WITH_AES_128_GCM_SHA256

logserverguard.ssl.http.enabled_ciphers:
- TLS_AES_256_GCM_SHA384
- TLS_AES_128_GCM_SHA256
- TLS_CHACHA20_POLY1305_SHA256
- TLS_ECDHE_ECDSA_WITH_AES_256_GCM_SHA384
- TLS_ECDHE_RSA_WITH_AES_256_GCM_SHA384
- TLS_ECDHE_ECDSA_WITH_CHACHA20_POLY1305_SHA256
- TLS_ECDHE_RSA_WITH_CHACHA20_POLY1305_SHA256
- TLS_ECDHE_ECDSA_WITH_AES_128_GCM_SHA256
- TLS_ECDHE_RSA_WITH_AES_128_GCM_SHA256
After editing restart Data Node service. Note that this settings should be updated on all cluster nodes.
Logserver GUI
Edit config file /etc/logserver-gui/logserver-gui.yml.
Example:
server.ssl.cipherSuites:
- TLS_AES_256_GCM_SHA384
- TLS_AES_128_GCM_SHA256
- TLS_CHACHA20_POLY1305_SHA256
- ECDHE-ECDSA-AES256-GCM-SHA384
- ECDHE-RSA-AES256-GCM-SHA384
- ECDHE-ECDSA-CHACHA20-POLY1305
- ECDHE-RSA-CHACHA20-POLY1305
- ECDHE-ECDSA-AES128-GCM-SHA256
- ECDHE-RSA-AES128-GCM-SHA256
After editing restart Logserver GUI service
Cerebro
Since 7.6.1 there is a default configuration for enabled algorithms on path /opt/cerebro/conf/java.config.
You can edit it and after restarting cerebro.service, changes will be applied.
7.6.0 and before
To recreate current default behavior, create file
/opt/cerebro/conf/java.configwith content:security.useSystemPropertiesFile=false jdk.tls.ephemeralDHKeySize=2048 jdk.certpath.disabledAlgorithms=MD2, SHA1, MD5, DSA, RSA keySize < 2048 jdk.tls.disabledAlgorithms=DH keySize < 2048, TLSv1.1, TLSv1, SSLv3, SSLv2, TLS_RSA_WITH_AES_256_CBC_SHA256, TLS_RSA_WITH_AES_256_CBC_SHA, TLS_RSA_WITH_AES_128_CBC_SHA256, TLS_RSA_WITH_AES_128_CBC_SHA, TLS_RSA_WITH_AES_256_GCM_SHA384, TLS_RSA_WITH_AES_128_GCM_SHA256, DHE_DSS, RSA_EXPORT, DHE_DSS_EXPORT, DHE_RSA_EXPORT, DH_DSS_EXPORT, DH_RSA_EXPORT, DH_anon, ECDH_anon, DH_RSA, DH_DSS, ECDH, 3DES_EDE_CBC, DES_CBC, RC4_40, RC4_128, DES40_CBC, RC2, HmacMD5, TLS_DHE_RSA_WITH_AES_128_CBC_SHA, TLS_DHE_RSA_WITH_AES_256_CBC_SHA jdk.tls.legacyAlgorithms=
Edit
ExecStartdefinition of/usr/lib/systemd/system/cerebro.servicelike so:ExecStart=/opt/cerebro/bin/cerebro "-Djava.security.properties=/opt/cerebro/conf/java.config" "-Dconfig.file=/opt/cerebro/conf/application.conf"
Reload systemd and restart cerebro.service
systemctl daemon-reload
systemctl reenable cerebro
systemctl restart cerebro
E-doc
Since 7.6.1 there is a default configuration for enabled ciphers on path /opt/e-doc/env.config.
You can edit it and after restarting e-doc.service, changes will be applied.
7.6.0 and before
To recreate current default behavior, create file
/opt/e-doc/env.configwith content:NODE_OPTIONS=--tls-cipher-list='TLS_AES_256_GCM_SHA384:TLS_CHACHA20_POLY1305_SHA256:TLS_AES_128_GCM_SHA256:ECDHE-RSA-AES128-GCM-SHA256:ECDHE-ECDSA-AES128-GCM-SHA256:ECDHE-RSA-AES256-GCM-SHA384:ECDHE-ECDSA-AES256-GCM-SHA384:DHE-RSA-AES128-GCM-SHA256:ECDHE-RSA-AES128-SHA256:DHE-RSA-AES128-SHA256:ECDHE-RSA-AES256-SHA384:DHE-RSA-AES256-SHA384:ECDHE-RSA-AES256-SHA256:DHE-RSA-AES256-SHA256:!aNULL:!eNULL:!EXPORT:!DES:!RC4:!MD5:!PSK:!SRP:!CAMELLIA'
Edit
/usr/lib/systemd/system/e-doc.service. Add following under[Service]section:EnvironmentFile=-/opt/e-doc/env.config
Reload systemd and restart e-doc.service
systemctl daemon-reload
systemctl reenable e-doc
systemctl restart e-doc
Network Probe
Since 7.6.1 there is a default configuration for enabled algorithms on path /etc/logserver-probe/java.properties.
Make sure there is a fallowing definition in /etc/logserver-probe/jvm.options:
-Djava.security.properties=/etc/logserver-probe/java.properties
You can edit it and after restarting Network Probe, changes will be applied.
7.6.0 and before
To recreate current default behavior, create file
/etc/logserver-probe/java.propertieswith content:security.useSystemPropertiesFile=false jdk.tls.ephemeralDHKeySize=2048 jdk.certpath.disabledAlgorithms=MD2, SHA1, MD5, DSA, RSA keySize < 2048 jdk.tls.disabledAlgorithms=DH keySize < 2048, TLSv1.1, TLSv1, SSLv3, SSLv2, TLS_RSA_WITH_AES_256_CBC_SHA256, TLS_RSA_WITH_AES_256_CBC_SHA, TLS_RSA_WITH_AES_128_CBC_SHA256, TLS_RSA_WITH_AES_128_CBC_SHA, TLS_RSA_WITH_AES_256_GCM_SHA384, TLS_RSA_WITH_AES_128_GCM_SHA256, DHE_DSS, RSA_EXPORT, DHE_DSS_EXPORT, DHE_RSA_EXPORT, DH_DSS_EXPORT, DH_RSA_EXPORT, DH_anon, ECDH_anon, DH_RSA, DH_DSS, ECDH, 3DES_EDE_CBC, DES_CBC, RC4_40, RC4_128, DES40_CBC, RC2, HmacMD5, TLS_DHE_RSA_WITH_AES_128_CBC_SHA, TLS_DHE_RSA_WITH_AES_256_CBC_SHA jdk.tls.legacyAlgorithms=
And add to
/etc/logserver-probe/jvm.options:-Djava.security.properties=/etc/logserver-probe/java.properties
After restarting Network Probe service, changes will be applied.
Masteragent
Since 7.6.1 Masteragent has a predefined strong ciphers already set. Updating is recommended.
Building a cluster
Node roles
Every instance of the Data Node server is called a node. A collection of connected nodes is called a cluster. All nodes know about all the other nodes in the cluster and can forward client requests to the appropriate node.
Besides that, each node serves one or more purposes:
- Master-eligible node - A node that has a node.master set to true (default), which makes it eligible to be elected as the master node, which controls the cluster
- Data node - A node that has a node.data set to true (default). Data nodes hold data and perform data-related operations such as CRUD, search, and aggregations
- Client node - A client node has both node.master and node.data set to false. It can neither hold data nor become the master node. It behaves as a “smart router” and is used to forward cluster-level requests to the master node and data-related requests (such as search) to the appropriate data nodes
- Tribe node - A tribe node, configured via the tribe.* settings, is a special type of client node that can connect to multiple clusters and perform search and other operations across all connected clusters.
Naming convention
Data Node requires little configuration before going to work.
The following settings must be considered before going to production:
- path.data and path.logs - default locations of the data.
- cluster.name - A node can only join a cluster when it shares its
cluster.namewith all the other nodes in the cluster. The default name is “logserver”, but you should change it to an appropriate name that describes the purpose of the cluster. You can do this in the/etc/logserver/logserver.ymlfile. - node.name - By default, Data Node will use the first seven characters of the randomly
generated UUID as the node ID. Node ID is persisted and does not change when a node restarts.
It is worth configuring a more human-readable name:
node.name: prod-data-2in file/etc/logserver/logserver.yml - network.host - parameter specifying network interfaces to which Data Node can bind. The default is
network.host: [”_local_”, “_site_”]. - discovery - Data Node uses a custom discovery implementation called “Zen Discovery”.
There are two important settings:
discovery.zen.ping.unicast.hosts- specify a list of other nodes in the cluster that are likely to be live and contactable;discovery.zen.minimum_master_nodes- to prevent data loss, you can configure this setting so that each master-eligible node knows the minimum number of master-eligible nodes that must be visible to form a cluster.
- heap size - By default, Data Node tells the JVM to use a heap with a minimum (Xms) and maximum (Xmx) size of 1 GB. When moving to production, it is important to configure heap size to ensure that Data Node has enough heap available
Config files
To configure the Data Node cluster you must specify some parameters in the Data Node main .yml configuration file on every node that will be connected to the cluster:
/etc/logserver:cluster.name:name_of_the_cluster- same for every node;node.name:name_of_the_node- uniq for every node;node.master:true_or_falsenode.data:true_or_falsenetwork.host:["_local_","_site_"]discovery.zen.ping.multicast.enableddiscovery.zen.ping.unicast.hosts
/etc/logserver/log4j2.properties:logger: action: DEBUG- for easier debugging.
TLS Certificates
To generate TLS certificates for each node of the cluster, you can check the logserver-cluster.yml config that is provided with the tlstool.sh.
cd /usr/share/logserver/utils/tlstool
bash tlstool.sh -c config/logserver-cluster.yml -ca -crt
Example setup
Example of the Data Node cluster configuration:
file
/etc/logserver/logserver.yml:cluster.name: tm-lab node.name: “logserver” node.master: true node.data: true network.host: 127.0.0.1,10.0.0.4 http.port: 9200 discovery.zen.ping.multicast.enabled: false discovery.zen.ping.unicast.hosts: [”10.0.0.4:9300”,”10.0.0.5:9300”,”10.0.0.6:9300”]
to start the Data Node cluster execute the systemctl restart command:
to check the status of the Data Node cluster execute the command:
check the Data Node cluster nodes status via TCP port:
 curl -XGET '127.0.0.1:9200/_cat/nodes?v'

   host            ip   heap.percent ram.percent load node.role master name
   10.0.0.4   10.0.0.4     18           91      0.00 -        -       els01
   10.0.0.5   10.0.0.5     66           91      0.00 d        *       els02
   10.0.0.6   10.0.0.6     43           86      0.65 d        m       els03
   10.0.0.7   10.0.0.7     45           77      0.26 d        m       els04
check the status of the Data Node cluster via the log file:
tail -f /var/log/logserver/tm-lab.log (cluster.name)
Adding a new node to the existing cluster
Install the new ITRS Log Analytics instance. The description of the installation can be found in the chapter “First Configuration Steps”
Change the following parameters in the configuration file:
cluster.name:name_of_the_cluster same for every node;node.name:name_of_the_node uniq for every node;node.master:true_or_falsenode.data:true_or_falsediscovery.zen.ping.unicast.hosts:[ “10.0.0.4:9300”, “10.0.0.5:9300”, “10.0.0.6:9300” ] - IP addresses and instances of nodes in the cluster.
If you add a node with the role data, delete the contents of the path.data directory, by default in /var/lib/logserver
Restart the Data Node instance of the new node with systemctl restart command
Disk-based shard allocation
Since version 7.4.3 of Logserver a feature was added to keep you informed about your disk usage. Disk-based shard allocation settings are used to determine the GUI behaviour.
 your cluster is running low on disk space low stage
 your cluster is running low on disk space high stage
 your cluster is running low on disk space flood stage
These labels will appear when a certain watermark level is exceeded. Its function is to inform you to take action. Maybe tweak your retention settings or add disk space to your servers.
With the “FLOOD STAGE”, non-administrative users will lose the ability to log into GUI, and those already logged in will be redirected to the status page. An administrator will still be able to browse and will have a chance to take action to fix the situation.
This is because with “FLOOD STAGE”, the system switches into a read-only mode. No new documents can be created or updated.
What is a watermark
Low stage
Controls the low watermark for disk usage. When exceeded Logserver will not allocate shards to that node. This setting does not affect the primary shards of newly-created indices but will prevent their replicas from being allocated.
High stage
Controls the high watermark. When exceeded Logserver will attempt to relocate shards away from a node whose disk exceeds it. This setting affects the allocation of all shards, whether previously allocated or not.
Flood stage
This setting is a last resort to prevent nodes from running out of disk space - which should be at all costs avoided.
Controls the flood stage watermark. Logserver enforces a read-only index block (index.blocks.read_only_allow_delete) on every index that has one or more shards allocated on the node, and that has at least one disk exceeding the flood stage. The index block is automatically released when the disk utilization falls below the high watermark.
Even if you are running Logserver in a single node environment, configuring the above is highly recommended.
While the GUI will always inform you about your disk usage, to take advantage of the above benefits you will need to configure the thresholds yourself especially if you are updating from an earlier Logserver version.
Configuring watermark stages
On fresh 7.4.3 or newer installations of Logserver these are the default watermark values:
- low: 95%
- high: 97%
- flood: 99%
To change them, you can use Logserver API like in the following example:
curl localhost:9200/_cluster/settings -XPUT -H 'content-type: application/json' -d '{
  "persistent": {
    "cluster.routing.allocation.disk.threshold_enabled": "true",
    "cluster.routing.allocation.disk.watermark.flood_stage": "10gb",
    "cluster.routing.allocation.disk.watermark.high": "25gb",
    "cluster.routing.allocation.disk.watermark.low": "50gb"
  }
}'
With that the “low stage” starts when the disk space for Logserver indices falls below the 50 GB mark; “high” below 25 GB and “flood” below 10 GB.
You can also use percentages for that but not both - you cannot mix byte values and percentages.
You can also modify Logserver configuration file
/etc/logserver/logserver.yml:cluster.routing.allocation.disk.threshold_enabled: true cluster.routing.allocation.disk.watermark.low: "50gb" cluster.routing.allocation.disk.watermark.high: "25gb" cluster.routing.allocation.disk.watermark.flood_stage: "10gb"
Take in mind you will have to change those values on all of your cluster nodes this way. Restart is not required as API was used earlier.
Important! Thanks to that, settings will be protected against a state failure.
Flood stage and read-only mode
When the cluster reaches the “flood stage”, it is automatically put into a read-only mode. It prevents a cluster failure - reaching 100% disk usage on a Logserver cluster is a critical issue!
The best way to remove the read-only mode is to make more disk space available for the cluster - either by adding more space or removing data (indices) from it. When the cluster reaches the “low stage” or below, it will automatically switch from the read-only mode.
Adjusting the levels with the above API examples to suit your installation is another option.
Disabling the threshold checking is not recommended! Also, changing the “threshold_enabled” setting to “false” does not turn the read-only mode off automatically!
Authentication with Active Directory
The AD configuration should be done in the /etc/logserver/properties.yml
file.
Below is a list of settings to be made in the properties.yml file
(the commented section in the file for the AD settings to
start working, this fragment should be uncommented):
ldaps:
 - name: "example.com"  # domain that is configured
   host: "127.0.0.1,127.0.0.2"  # list of server for this domain
   #port: 389 # optional, default 389 for unencrypted session or 636 for encrypted sessions
   ssl_enabled: false  # optional, default true
   #ssl_trust_all_certs: true # optional, default false
   #ssl.keystore.file: "path" # path to the truststore store
   #ssl.keystore.password: "path" # password to the trusted certificate store
   bind_dn: [admin@example.com] # account name administrator
   bind_password: "password" # password for the administrator account
   search_user_base_DN: "OU=lab,DC=example,DC=com" # search for the DN user tree database
   #user_id_attribute: "uid # search for a user attribute optional, by default "uid"
   #search_groups_base_DN: "OU=lab,DC=example,DC=com" # group database search. This is a catalog main, after which the groups will be sought.
   #unique_member_attribute: "uniqueMember" # optional, default "uniqueMember"
   connection_pool_size: 10 # optional, default 30
   connection_timeout_in_sec: 10 # optional, default 1
   request_timeout_in_sec: 10 # optional, default 1*
   cache_ttl_in_sec: 60 # optional, default 0 - cache disabled
   #authentication_only: true    # optional ignore role-mapping settings
   #default_authentication_roles: [ "roleName1", "roleName2" ]      # roles asigned to new users authenticating using this LDAP server, used when authentication_only = true
If we want to configure multiple domains, then in this configuration file we copy the # LDAP section below and configure it for the next domain.
Below is an example of how an entry for 2 domains should look like. (It is important to take the interpreter to read these values correctly).
ldaps:
  - name: "example1.com" #DOMAIN 1
    host: "127.0.0.1,127.0.0.2"
    bind_dn: "esauth@example1.com"
    bind_password: "password"
    search_user_base_DN: "cn=Users,DC=example1,DC=com"
    ssl_enabled: false
  - name: "example2.com" #DOMAIN 2
    host: "127.0.0.1,127.0.0.2"
    bind_dn: "esauth@example2.com"
    bind_password: "password"
    search_user_base_DN: "cn=Users,DC=example2,DC=com"
    ssl_enabled: false
After completing the LDAP section entry in the properties.yml file,
save the changes and reload the module with the below command:
curl -sS -uUSER:PASSWORD localhost:9200/_logserver/auth/reload -XPOST
Example:
curl -sS -ulogserver:logserver localhost:9200/_logserver/auth/reload -XPOST
Configure SSL support for AD authentication
Open the certificate manager on the AD server.
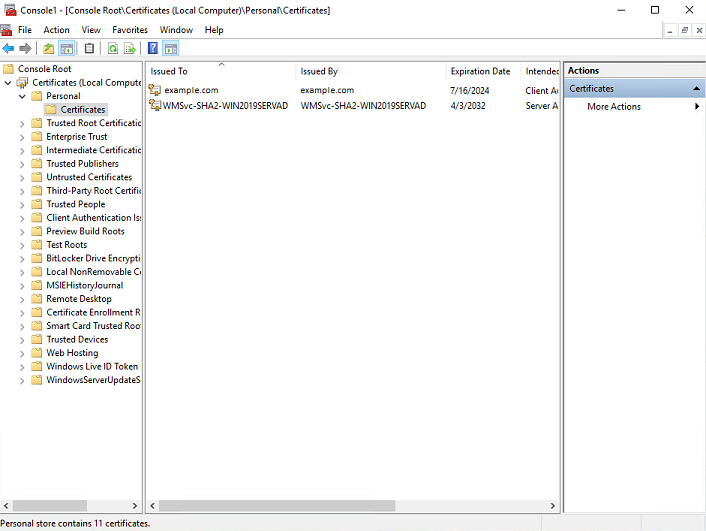
Select the certificate and open it
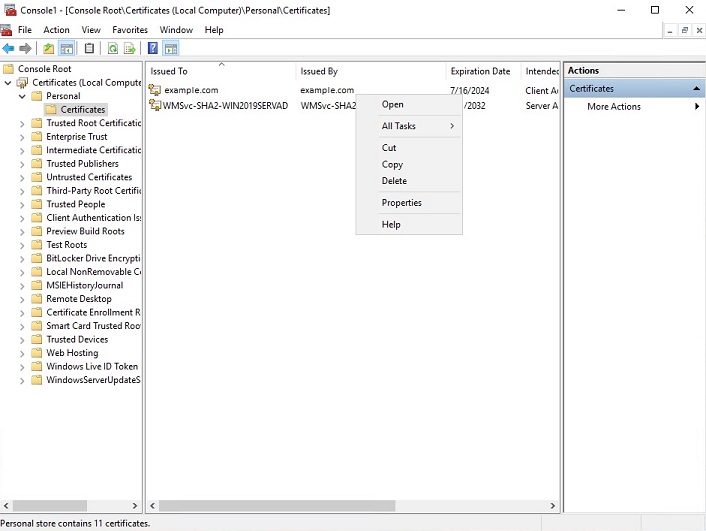
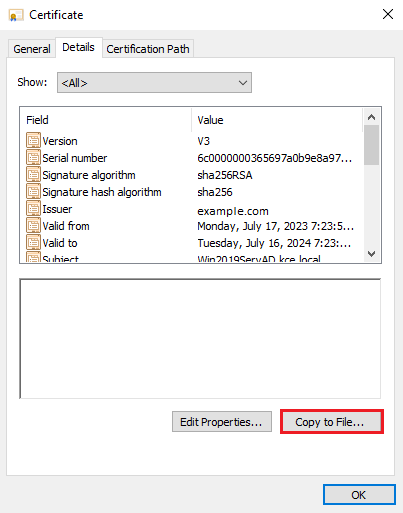
Select the option of copying to a file in the Details tab
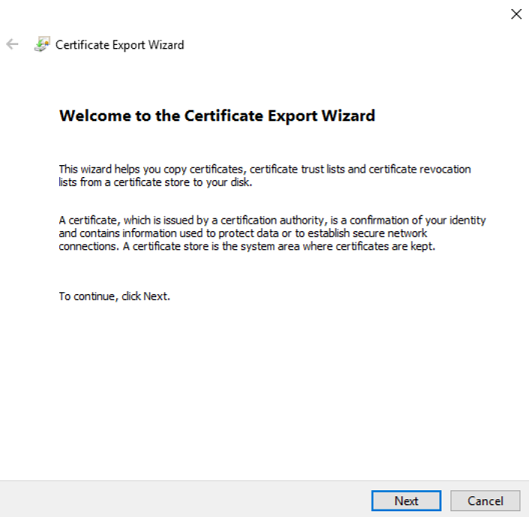
Click the Next button
Keep the setting as shown below and click Next
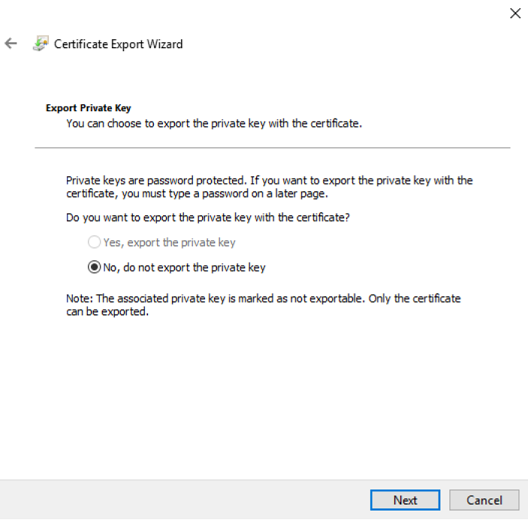
Keep the setting as shown below and click Next.
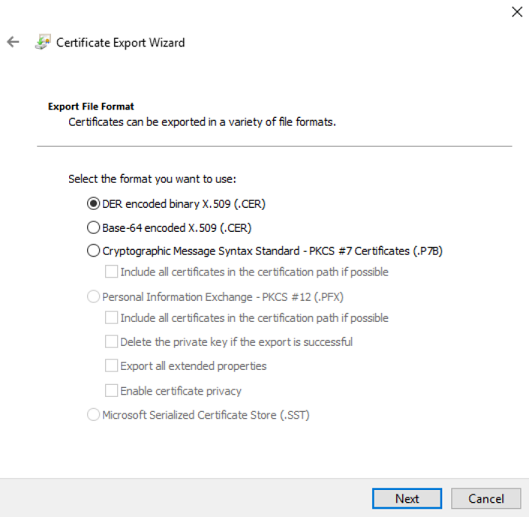
Give the name a certificate
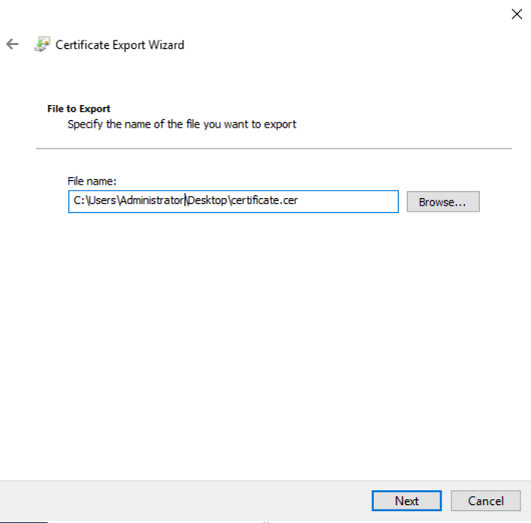
After the certificate is exported, this certificate should be imported into a trusted certificate file that will be used by the Data Node plugin.
To import a certificate into a trusted certificate file, a tool called „keytool.exe” is located in the JDK installation directory.
Use the following command to import a certificate file:
keytool -import -alias adding_certificate_keystore -file certificate.cer -keystore certificatestore
The values certificat.cer and certificationstore should be changed accordingly.
By doing this, he will ask you to set a password for the trusted
certificate store. Remember this password, because it must be set in
the configuration of the Data Node plugin. The following settings
must be set in the properties.yml configuration for
SSL:
 ssl.keystore.file: "<path to the trust certificate store>"
 ssl.keystore.password: "<password to the trust certificate store>"
Role mapping
In the /etc/logserver/properties.yml configuration file you can find
a section for configuring role mapping:
# LDAP ROLE MAPPING FILE
# rolemapping.file.path: /etc/logserver/role-mappings.yml
This variable points to the file /etc/logserver/role-mappings.yml
Below is the sample content for this file:
# admin - superuser group
admin:
  - "CN=Admins,CN=Builtin,DC=example,DC=com"

gui-access:
  - "CN=Admins,CN=Builtin,DC=example,DC=com"
Attention. The role you define in the role-mapping.yml file must be created in the ITRS Log Analytics.
How to the mapping mechanism work? An AD user logs in to ITRS Log Analytics. In the application, there is a gui-access role, which through the file role-mapping.yml binds to the name of an AD group of which the user is a member. Additionally, this AD group binds to the ITRS Log Analytics admin role, which points to permission granted to the user in the application.
Similarly, the mechanism will work for any other role in the application. Important in this configuration is to add every AD group to gui-access which grants permission to log in and at least one more role which grants permission to some data.
The gui-access role is not visible in GUI, it’s only used to grant permission to log in.
If field authentication_only is true, user roles will not be mapped and they will be taken from the default_authentication_roles field. When the default_authentication_roles field is not added in properties.yaml, a user without a role will be created.
Below is a screenshot of the console on which are marked accounts that were created by users logging in from AD
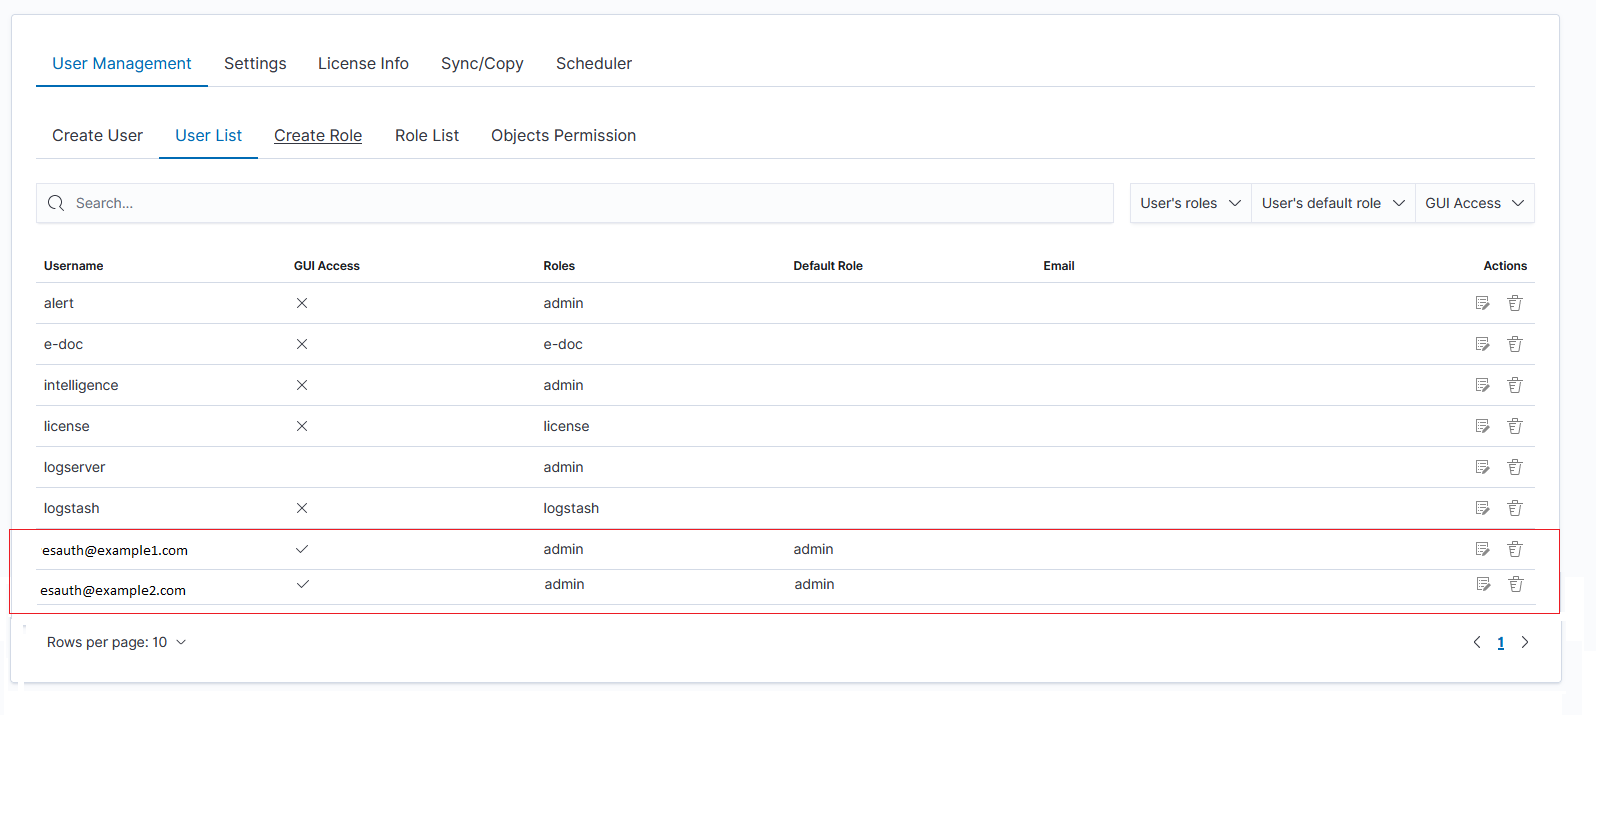
If you map roles from several domains, for example, dev.example1.com, and dev.example2.com then in the User List we will see which user from which domain with which role logged in ITRS Log Analytics.
Password encryption
For security reasons, you can provide the encrypted password for Active Directory integration.To do this use pass-encrypter.sh script that is located in the Utils directory in the installation folder.
Installation of pass-encrypter
cp -pr /instalation_folder/logserver/pass-encrypter /usr/share/logserver/
Use pass-encrypter
/usr/share/logserver/utils/pass-encrypter/pass-encrypter.sh

Enter the string for encryption :
new_password
Encrypted string : MTU1MTEwMDcxMzQzMg==1GEG8KUOgyJko0PuT2C4uw==
Authentication with Radius
To use the Radius protocol, install the latest available version of ITRS Log Analytics.
Configuration
The default configuration file is located at /etc/logserver/properties.yml:
# Radius opts
#radius.host: "10.4.3.184"
#radius.secret: "querty1q2ww2q1"
#radius.port: 1812
Use appropriate secret based on config file in Radius server. The secret is configured on clients.conf in the Radius server.
In this case, since the plugin will try to do Radius auth, the client IP address should be the IP address where the Data Node is deployed.
Every user by default at present gets the admin role
Authentication with LDAP
To use OpenLDAP authorization, install or update ITRS Log Analytics too at least 7.0.2.
Configuration
The default configuration file is located at /etc/logserver/properties.yml:
ldap_groups_search - Enable Open LDAP authorization. The
ldap_groups_searchswitch with true/false values.search filter - you can define
search_filterfor each domain. When polling the LDAP / AD server, the placeholder is changed to theuserId(everything before @domain) of the user who is trying to log in. Sample search_filter:search_filter: "(&(objectClass=inetOrgPerson)(cn=%s))"
If no search_filter is given, the default will be used:
(&(&(objectCategory=Person)(objectClass=User))(samaccountname=%s))
max_connections - for each domain (must be> = 1), this is the maximum number of connections that will be created with the LDAP / AD server for a given domain. Initially, one connection is created, if necessary another, up to the maximum number of connections set. If max_connections is not given, the default value = 10 will be used.
ldap_groups_search - filter will be used to search groups on the AD / LDAP server to which the user is trying to log in. An example of groups_search_filter that works quite universally is:
groups_search_filter: "(|(uniqueMember=%s)(member=%s))"
Sample configuration:
licenseFilePath: /usr/share/logserver/

ldaps:

    - name: "dev.it.example.com"
      host: "192.168.0.1"
      port: 389                                                  # optional, default 389
      #ssl_enabled: false                                        # optional, default true
      #ssl_trust_all_certs: true                                 # optional, default false
      bind_dn: "Administrator@dev2.it.example.com"
      bind_password: "Buspa#mexaj1"
      search_user_base_DN: "OU=lab,DC=dev,DC=it,DC=example,DC=pl"
      search_filter: "(&(objectClass=inetOrgperson)(cn=%s))"     # optional, default "(&(&(objectCategory=Person)(objectClass=User))(samaccountname=%s))"
      user_id_attribute: "uid"                                   # optional, default "uid"
      search_groups_base_DN: "OU=lab,DC=dev,DC=it,DC=example,DC=pl" # base DN, which will be used for searching user's groups in LDAP tree
      groups_search_filter: "(member=%s)"                        # optional, default (member=%s), if ldap_groups_search is set to true, this filter will be used for searching user's membership of LDAP groups
      ldap_groups_search: false                                  # optional, default false - user groups will be determined basing on user's memberOf attribute
      unique_member_attribute: "uniqueMember"                    # optional, default "uniqueMember"
      max_connections: 10                                        # optional, default 10
      connection_timeout_in_sec: 10                              # optional, default 1
      request_timeout_in_sec: 10                                 # optional, default 1
      cache_ttl_in_sec: 60                                       # optional, default 0 - cache disabled
When the password is longer than 20 characters, we recommend using our pass-encrypter, otherwise, the backslash must be escaped with another backslash. Endpoint
role-mapping/_reloadhas been changed to_role-mapping/reload. This is a unification of API conventions, following Data Node conventions.
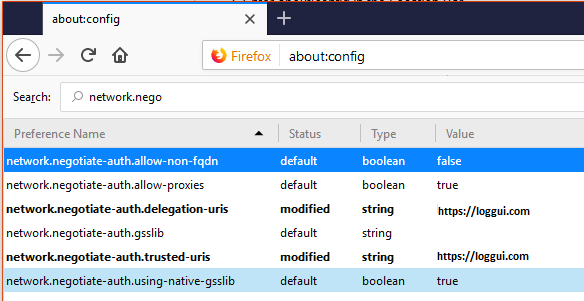
Configuring Single Sign On (SSO)
To configure SSO, the system should be accessible by domain name URL, not IP address or localhost.
Correct: https://loggui.com:5601/login
Wrong: https://localhost:5601/login, https://10.0.10.120:5601/login
The configuration description described below is based on:
- AD Domain / Realm:
example.com - AD IP Address:
192.168.3.111 - GUI Url:
loggui.com
To enable SSO on your system, follow the steps below.
Configuration steps
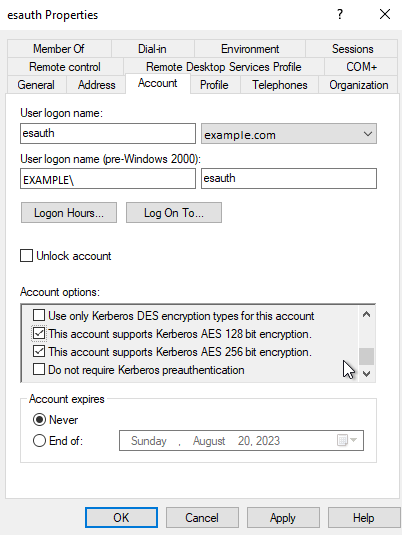
Create a User Account for Data Node auth plugin
In this step, a Kerberos Principal representing the Data Node auth plugin is created on the Active Directory. The principal name would bename@EXAMPLE.COM, while theEXAMPLE.COMis the administrative name of the realm.Create a User in AD. Set “Account never expires” and enable support for Kerberos encryption as shown below.
Define the Service Principal Name (SPN) and Create a keytab file for it
Use the following command to create the keytab file identyfying the SPN:
C:> ktpass -out c:\Users\Administrator\esauth.keytab -princ HTTP/loggui.com@EXAMPLE.COM -mapUser esauth -mapOp set -pass 'Sprint$123' -crypto ALL -pType KRB5_NT_PRINCIPAL
Details of the used switches:
-out- path to the keytab file-mapUser- name of the previously created AD user. It might need to be preceded with pre-Windows 2000 logon if user cannot be found (e.g.EXAMPLE\esauthon the screenshot).-princ- service principal name. Must start with uppercase HTTP/ and must end with uppercase domain after the @ sign. Will be used later to configure principal.-pass- password that secures the keytab file itself (not connected user’s password!). Will be used later to configure principal’s password.
For more details about the
ktpass tool, please refer to the official documentation: ktpass details.The
esauth.keytabfile should be placed on your Data Node node - preferably/etc/logserver/with read permissions for Data Node user:chmod 640 /etc/logserver/esauth.keytab chown user: /etc/logserver/esauth.keytab
Create a file named krb5Login.conf:
  com.sun.security.jgss.initiate {
      com.sun.security.auth.module.Krb5LoginModule required
      principal="HTTP/loggui.com@EXAMPLE.COM"
      useKeyTab=true
      keyTab=/etc/logserver/esauth.keytab
      storeKey=true
      debug=true;
    };
  com.sun.security.jgss.krb5.accept {
    com.sun.security.auth.module.Krb5LoginModule required
    principal="HTTP/loggui.com@EXAMPLE.COM"
    useKeyTab=true
    keyTab=/etc/logserver/esauth.keytab
    storeKey=true
    debug=true;
  };
The principal user and keyTab location should be changed as per the values created in Step 2. Make sure the domain is in UPPERCASE as shown above. The
krb5Login.conffile should be placed on your Data Node node, for instance,/etc/logserver/with read permissions for the Data Node user:sudo chmod 640 /etc/logserver/krb5Login.conf sudo chown user: /etc/logserver/krb5Login.conf
Uncomment and edit JVM arguments, in
/etc/logserver/jvm.options.d/single-sign-logon.optionsas shown below:-Dsun.security.krb5.debug=false \ -Djava.security.krb5.realm=**EXAMPLE.COM** \ -Djava.security.krb5.kdc=**192.168.3.111** \ -Djava.security.auth.login.config=/etc/logserver/krb5Login.conf \ -Djavax.security.auth.useSubjectCredsOnly=false
Change the
.krb5.realmand.krb5.kdcto the appropriate values.Realmis defined as used domain (must be in UPPERCASE) realm and.kdcis AD’s IP address. Those JVM arguments have to be set for the Logserver server.Authentication options if
authentication_only: trueis setIf a user does not exist, Logserver will create the user without a role. Role in
role-mapping.ymlwould be ignored and rolegui-accessfromdefault_authentication_roles: ["gui-access"]will be assigned.Add the following additional (sso.domain, service_principal_name, service_principal_name_password) settings for LDAP in properties.yml file:
sso.domain: "example.com"
ldaps:
 - name: "example.com"
     host: "IP_address"
     port: 389                                      # optional, default 389
     ssl_enabled: false                             # optional, default    true
     ssl_trust_all_certs: false                     # optional, default false
     bind_dn: "esauth@example.com"                  # optional, skip for anonymous bind
     bind_password: "password"                      # optional, skip for anonymous bind (AD admin's password)
     search_user_base_DN: "cn=Users,DC=example,DC=com"
     user_id_attribute: "uid"                       # optional, default "uid"
     unique_member_attribute: "uniqueMember"        # optional, default "uniqueMember"

     service_principal_name: "HTTP/loggui.com@EXAMPLE.COM" # principal name used while generating the keytab file
     service_principal_name_password: "Sprint$123" # -pass used during keytab creation
Note: At this moment, SSO works for only a single domain. So you have to mention for what domain SSO should work in the above property
sso.domain- in this example it should be “example.com”.After completing the LDAP section entry in the properties.yml file, save the changes and send a request for reload authentication data with the command:
curl -sS -u username:password localhost:9200/_logserver/auth/reload -XPOST
Enable the SSO feature in the
logserver-gui.ymlfile:login.sso_enabled: true
After that Logserver GUI has to be restarted with systemctl restart command
Client (Browser) Configuration
Internet Explorer configuration
Go to
Internet Optionsfrom theToolsmenu and click onSecurityTab: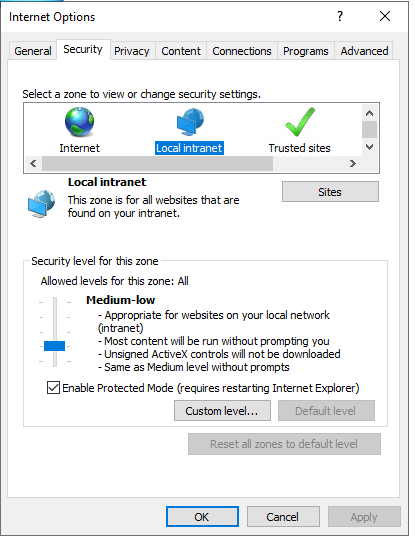
Select
Local intranet, click onSite->Advanced-> Provide correct URL -> ClickAdd: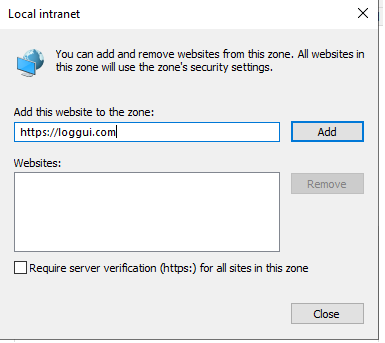
After adding the site click close.
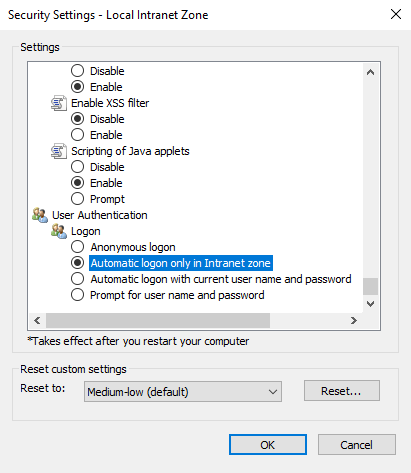
Click on the custom level and select the option as shown below:
Chrome configuration
For Chrome, the settings are taken from the IE browser.
KBC error codes
| KDC error codes | Description |
|---|---|
| 0 | No error |
| 1 | Client entry is expired |
| 2 | Server entry is expired |
| 3 | Protocol version is not supported |
| 4 | Client key is encrypted in an old master key |
| 5 | Server key is encrypted in an old master key |
| 6 | Client is not defined in the security registry |
| 7 | Server is not defined in the security registry |
| 8 | Principal is not unique in the security registry |
| 9 | No key is available for the principal |
| 10 | Ticket is not eligible for postdating |
| 11 | Ticket is never valid |
| 12 | Request rejected due to KDC policy |
| 13 | Request option is not supported |
| 14 | Encryption type is not supported |
| 15 | Checksum type is not supported |
| 16 | Preauthentication type is not supported |
| 17 | Transited data type is not supported |
| 18 | Client account is revoked |
| 19 | Server account is revoked |
| 20 | TGT is revoked |
| 21 | Client account is not valid yet |
| 22 | Server account is not valid yet |
| 23 | Password is expired |
| 24 | Preauthentication failed |
| 25 | Preauthentication required |
| 26 | Supplied authentication ticket is not for the requested server |
| 27 | Server requires user-to-user protocol |
| 31 | Decryption integrity check failed |
| 32 | Ticket is expired |
| 33 | Ticket is not valid yet |
| 34 | Request is a replay of a previous request |
| 35 | Supplied authentication ticket is not for the current realm |
| 36 | Ticket and authenticator do not match |
| 37 | Clock skew is too great |
| 38 | Incorrect network address |
| 39 | Protocol version mismatch |
| 40 | Invalid message type |
| 41 | Message stream has been modified |
| 42 | Message is out of order |
| 44 | Key version is not available |
| 45 | Service key is not available |
| 46 | Mutual authentication failed |
| 47 | Incorrect message direction |
| 48 | Alternative authentication method required |
| 49 | Incorrect message sequence number |
| 50 | Inappropriate checksum type |
| 60 | Generic error detected |
| 61 | Field is too long |
| 62 | Client certificate is not acceptable |
| 63 | KDC certificate is not trusted or does not meet requirements |
| 64 | Certificate signature not valid |
| 65 | Client Diffie-Hellman key parameters not accepted |
| 70 | Client certificate could not be verified |
| 71 | Client certificate chain validation error occurred |
| 72 | Client certificate chain contains a revoked certificate |
| 73 | Revocation status for the certificate chain could not be determined |
| 75 | Kerberos client name does not match name bound to the client certificate |
| 76 | Kerberos KDC name does not match name bound to the KDC certificate |
| 77 | Key purpose restricts certificate usage |
| 78 | Certificate signature digest algorithm is not supported |
| 79 | PKAuthenticator is missing the required paChecksum |
| 80 | The signedData digest algorithm is not supported |
| 81 | The Public Key encryption delivery method is not supported |
Configure email delivery
Configure email delivery for sending PDF reports in Scheduler
The default e-mail client that installs with the Linux CentOS system, which is used by ITRS Log Analytics to send reports (Section 5.3 of the Reports chapter), is postfix.
Configuration file for postfix mail client
The postfix configuration directory for CentOS is /etc/postfix. It contains files:
main.cf - the main configuration file for the program specifying the basic parameters
Some of its directives:
| Directive | Description |
|---|---|
| queue_directory | The postfix queue location. |
| command_directory | The location of Postfix commands. |
| daemon_directory | Location of Postfix daemons. |
| mail_owner | The owner of Postfix domain name of the server |
| myhostname | The fully qualified domain name of the server. |
| mydomain | Server domain |
| myorigin | Host or domain to be displayed as origin on email leaving the server. |
| inet_interfaces | Network interface to be used for incoming email. |
| mydestination | Domains from which the server accepts mail. |
| mynetworks | The IP address of trusted networks. |
| relayhost | Host or other mail server through which mail will be sent. This server will act as an outbound gateway. |
| alias_maps | Database of aliases used by the local delivery agent. |
| alias_database | Alias database generated by the new aliases command. |
| mail_spool_directory | The location where user boxes will be stored. |
master.cf - defines the configuration settings for the master daemon and the way it should work with other agents to deliver mail. For each service installed in the master.cf file seven columns define how the service should be used.
| Column | Description |
|---|---|
| service | The name of the service |
| type | The transport mechanism to be used. |
| private | Is the service only for user by Postfix. |
| unpriv | Can the service be run by ordinary users |
| chroot | Whether the service is to change the main directory (chroot) for the mail. Queue. |
| wakeup | Wake up interval for the service. |
| maxproc | The maximum number of processes on which the service can be forked (to divide into branches) |
| command + args | A command associated with the service plus any argument |
access - can be used to control access based on an e-mail address, host address, domain, or network address.
Examples of entries in the file
| Description | Example |
|---|---|
| To allow access for specific IP address: | 192.168.122.20 OK |
| To allow access for a specific domain: | example.com OK |
| To deny access from the 192.168.3.0/24 network: | 192.168.3 REJECT |
After making changes to the access file, you must convert its contents to the access.db database with the postmap command:
  postmap /etc/postfix/access

  ll /etc/postfix/access*

   -rw-r--r--. 1 root root 20876 Jan 26 2014 /etc/postfix/access
   -rw-r--r--. 1 root root 12288 Feb 12 07:47 /etc/postfix/access.db
canonical - mapping incoming e-mails to local users.
Examples of entries in the file:
To forward emails to user1 to the [user1@yahoo.com] mailbox:
user1 user1@yahoo.com
To forward all emails for example.org to another example.com domain:
@example.org @example.com
After making changes to the canonical file, you must convert its contents to the canonical.db database with the postmap command:
  postmap /etc/postfix/canonical

  ll /etc/postfix/canonical*

  -rw-r--r--. 1 root root 11681 2014-06-10 /etc/postfix/canonical
  -rw-r--r--. 1 root root 12288 07-31 20:56 /etc/postfix/canonical.db
generic - mapping of outgoing e-mails to local users. The syntax is the same as a canonical file. After you make a change to this file, you must also run the postmap command.
  postmap /etc/postfix/generic

  ll /etc/postfix/generic*

  -rw-r--r--. 1 root root 9904 2014-06-10 /etc/postfix/generic
  -rw-r--r--. 1 root root 12288 07-31 21:15 /etc/postfix/generic.db
relocated – information about users who have been transferred. The syntax of the file is the same as canonical and generic files.
Assuming the user1 was moved from example.com to example.net, you can forward all emails received at the old address to the new address:
Example of an entry in the file:
<user1@example.com> <user1@example.net>
After you make a change to this file, you must also run the postmap command.
postmap /etc/postfix/relocated
ll /etc/postfix/relocated*

  -rw-r--r--. 1 root root 6816 2014-06-10 /etc/postfix/relocated
  -rw-r--r--. 1 root root 12288 07-31 21:26 /etc/postfix/relocated.d
transport – mapping between e-mail addresses and the server through which these e-mails are to be sent (next hops) in the transport format: nexthop.
Example of an entry in the file:
<user1@example.com> smtp:host1.example.com
After you make changes to this file, you must also run the postmap command.
postmap /etc/postfix/transport
ll /etc/postfix/transport*

  -rw-r--r--. 1 root root 12549 2014-06-10 /etc/postfix/transport
  -rw-r--r--. 1 root root 12288 07-31 21:32 /etc/postfix/transport.db
virtual - user to redirect e-mails intended for a certain user to the account of another user or multiple users. It can also be used to implement the domain alias mechanism.
Examples of the entries in the file:
Redirecting email for user1, to root users and user3:
user1 root,user3
Redirecting email for user 1 in the example.com domain to the root user:
<user1@example.com> root
After you make a change to this file, you must also run the postmap command:
postmap /etc/postfix/virtual

ll /etc/postfix/virtual

-rw-r--r--. 1 root root 12494 2014-06-10 /etc/postfix/virtual
-rw-r--r--. 1 root root 12288 07-31 21:58 /etc/postfix/virtual.db
Basic postfix configuration
Base configuration of postfix application you can make in
/etc/postfix/main.cf configuration file, which must be completed with the following entry:
section # RECEIVING MAIL
inet_interfaces = all
inet_protocols = ipv4
section # INTERNET OR INTRANET
relayhost = [IP mail server]:25 (port number)
In the next step, you must complete the canonical file of the postfix
At the end, you should restart the postfix:
systemctl restart postfix
Example of postfix configuration with SSL encryption enabled
To configure email delivery with SSL encryption you need to make the following changes in the postfix configuration files:
/etc/postfix/main.cf- file should contain the following entries in addition to standard (unchecked entries):mydestination = $myhostname, localhost.$mydomain, localhost myhostname = example.com relayhost = [smtp.example.com]:587 smtp_sasl_auth_enable = yes smtp_sasl_password_maps = hash:/etc/postfix/sasl_passwd smtp_sasl_security_options = noanonymous smtp_tls_CAfile = /root/certs/cacert.cer smtp_use_tls = yes smtp_sasl_mechanism_filter = plain, login smtp_sasl_tls_security_options = noanonymous canonical_maps = hash:/etc/postfix/canonical smtp_generic_maps = hash:/etc/postfix/generic smtpd_recipient_restrictions = permit_sasl_authenticated
/etc/postfix/sasl_passwd- file should define the data for authorized[smtp.example.com]:587 [USER@example.com:PASS] [smtp.example.com]:587 username:password
You need to give appropriate permissions:
chmod 400 /etc/postfix/sasl_passwd
and map configuration to the database:
postmap /etc/postfix/sasl_passwd
postmap /etc/postfix/canonical
postmap /etc/postfix/generic
next, you need to generate a CA cert file:
cat /etc/ssl/certs/Example_Server_CA.pem | tee -a etc/postfix/cacert.pem
Finally, you need to restart the postfix
systemctl restart postfix
Custom notification on the workstation
The mechanism of personalization of notification at the workstation will be implemented by combining alerting mechanisms, triggering integrated commands, and triggering interaction scripts allowing for the transfer of a personalized notification to the workstation. The notifications will use a specific script, which can inform all logged-in users or the selected one about the detection of individual incidents.
Configuration steps
Create a new alert rule or edit an existing one according to the instruction: Creating Alerts,
In the
Alert`` Methodfield select theCommandmethod,Add the following script name to
Path to script/commandfield:notifyworkstation.py
Agents module
Before use ensure that you have all the required files
Tool for generating the necessary certificates:
/usr/share/logserver/utils/tlstool/tlstool.sh;Network Probe utilities:
  ./integrations/masteragent/conf.d/masteragent {01-input-agents.conf, 050-filter-agents.conf, 100-output-agents.conf}
  ./integrations/masteragent/masteragent.yml.off.
Linux Agent files:
./agents/masteragent/agents/linux/masteragent:- Executable:
MasterBeatAgent.jar - Configuration File for MasterAgent (server):
MasterBeatAgent.conf - Configuration File for Agent (client):
agent.conf - Service file:
masteragent.service
- Executable:
Preparations
EVERY COMMAND HAS TO BE EXECUTED FROM /INSTALL DIRECTORY.
Generate the certificates using
tlstools.shscript from/usr/share/logserver/utils/tlstool/.Update the IP of the node directive, by replacing
<Network Probe ip address> with the Network Probe server ip in the provided masteragent.yml config (/usr/share/logserver/utils/tlstool/config/masteragent.yml).Generate certs using masteragent configuration (by default it will be saved to the
out/dir):/usr/share/logserver/utils/tlstool/tlstool.sh -c /usr/share/logserver/utils/tlstool/config/masteragent.yml -ca -crt -t agents/masteragent/certificates
Create KeyStore and TrustStore. Set the KeyStore password of your choice that is utilized to securely store certificates:
cd agents/masteragent/certificates
keytool -import -file rootCA.crt -alias root -keystore root.jks -storetype jks
openssl pkcs12 -export -in localhost.crt -inkey localhost.key -out node_name.p12 -name localhost -certfile rootCA.crt
cd -
Set the KeyStore password of your choice that is utilized to securely store certificates.
Type ‘yes’ when “Trust this certificate?” monit will be shown.
Set the TrustStore password of your choice that is used to secure CAs. Remember entered passwords - they’ll be used later!
Configure firewall to enable communication on used ports (defaults: TCP 8080 -> Network Probe, TCP 8081 -> agent’s server).
These ports can be changed but must reflect “port” and “Network Probe” directives from an agent.conf file to ensure a connection with the agent.
Commands for default ports:
firewall-cmd --permanent --zone public --add-port 8080/tcp
firewall-cmd --permanent --zone public --add-port 8081/tcp
Configure Network Probe:
Copy files:
cp -rf ./integrations/masteragent/conf.d/* /etc/logserver-probe/conf.d/
Copy pipeline configuration:
cp -rf ./integrations/masteragent/*.yml.off /etc/logserver-probe/pipelines.d/masteragent.yml
cat ./integrations/masteragent/masteragent.yml.off >> /etc/logserver-probe/pipelines.yml
Configure SSL connection, by copying previously generated certificates:
mkdir -p /etc/logserver-probe/conf.d/masteragent/ssl
/bin/cp -rf ./agents/masteragent/certificates/localhost.* ./agents/masteragent/certificates/rootCA.crt /etc/logserver-probe/conf.d/masteragent/ssl/
Set permissions:
chown -R user:group /etc/logserver-probe/conf.d/masteragent
Restart service Network Probe service with systemctl restart command
Installation of MasterAgent - Server Side
Copy executable and config:
mkdir -p /opt/agents
/bin/cp -rf ./agents/masteragent/agents/linux/masteragent/MasterBeatAgent.jar /opt/agents
/bin/cp -rf ./agents/masteragent/agents/linux/masteragent/MasterBeatAgent.conf /opt/agents/agent.conf
Copy certificates:
/bin/cp -rf ./agents/masteragent/certificates/node_name.p12 ./agents/masteragent/certificates/root.jks /opt/agents/
Set permissions:
chown -R user:group /opt/agents
Update the configuration file with KeyStore/TrustStore paths and passwords. Use your preferred editor eg. vim:
vim /opt/agents/agent.conf
Installation of Agent - Client Side
Linux
FOR WINDOWS AND LINUX: `Client requires at least Java 1.8+.
Linux Agent - software installed on clients running on Linux OS:
Install net-tools package to use Agent on Linux RH / Centos:
yum install net-tools
Copy executable and config:
mkdir -p /opt/masteragent
/bin/cp -rf ./agents/masteragent/agents/linux/masteragent/agent.conf ./agents/masteragent/agents/linux/masteragent/MasterBeatAgent.jar /opt/masteragent
/bin/cp -rf ./agents/masteragent/agents/linux/masteragent/masteragent.service /usr/lib/systemd/system/masteragent.service
Copy certificates:
/bin/cp -rf ./certificates/node_name.p12 ./certificates/root.jks /opt/masteragent/
Update the configuration file with KeyStore/TrustStore paths and passwords. Also, update the IP and port (by default 8080 is used) of the Network Probe host that the agent will connect to with the ‘Network Probe’ directive. Use your preferred editor eg. vim:
vim /opt/masteragent/agent.confEnable masteragent service:
systemctl daemon-reload
systemctl enable masteragent
systemctl start masteragent
Finally, verify in the Logserver GUI ‘Agents’ plugin if a newly added agent is present. Check masteragent logs executing:
journalctl -fu masteragent
Windows
FOR WINDOWS AND LINUX: `Client requires at least Java 1.8+.
Ensure that you have all required files (
./install/agents/masteragent/agents/windows/masteragent):- Installer and manifest:
agents.exe,agents.xml - Client:
Agents.jar - Configuration File:
agent.conf
- Installer and manifest:
Configure firewall:
Add an exception to the firewall to listen on TCP port 8081. Add an exception to the firewall to allow outgoing connection to TCP port masteragent:8080 (reasonable only with configured “
http_enabled = true”)Create
C:\Program Files\MasterAgentdirectory.Copy the contents of the
./install/agents/masteragent/agents/windows/masteragentdirectory to theC:\Program Files\MasterAgent.Copy node_name.p12 and root.jks files from the
./install/agents/masteragent/certificatesto desired directory.Update the
C:\Program Files\MasterAgent\agent.conffile with KeyStore/TrustStore paths from the previous step and passwords. Also, update the IP and port (by default 8080 is used) of the Network Probe host that the agent will connect to with the ‘Network Probe’ directive.Start PowerShell as an administrator:
To install an agent you can use interchangeably the following methods:
Method 1 - use installer:
cd "C:\Program Files\MasterAgent"
.\agents.exe install
.\agents.exe start
Method 2 - manually creating service:
New-Service -name masteragent -displayName masteragent -binaryPathName "C:\Program Files\MasterAgent\agents.exe"
Finally, verify in the Logserver GUI ‘
Agents’ plugin if a newly added agent is present. To check out logs and errors, look for ‘agents.out.log’ and ‘agents.err.log’ files in theC:\Program Files\MasterAgentdirectory after the service starts. Also, check the service status:.\agents.exe status
Beats - configuration templates
Go to the
Agentswhich is located in the main menu. Then go toTemplatesand click theAdd templatebutton.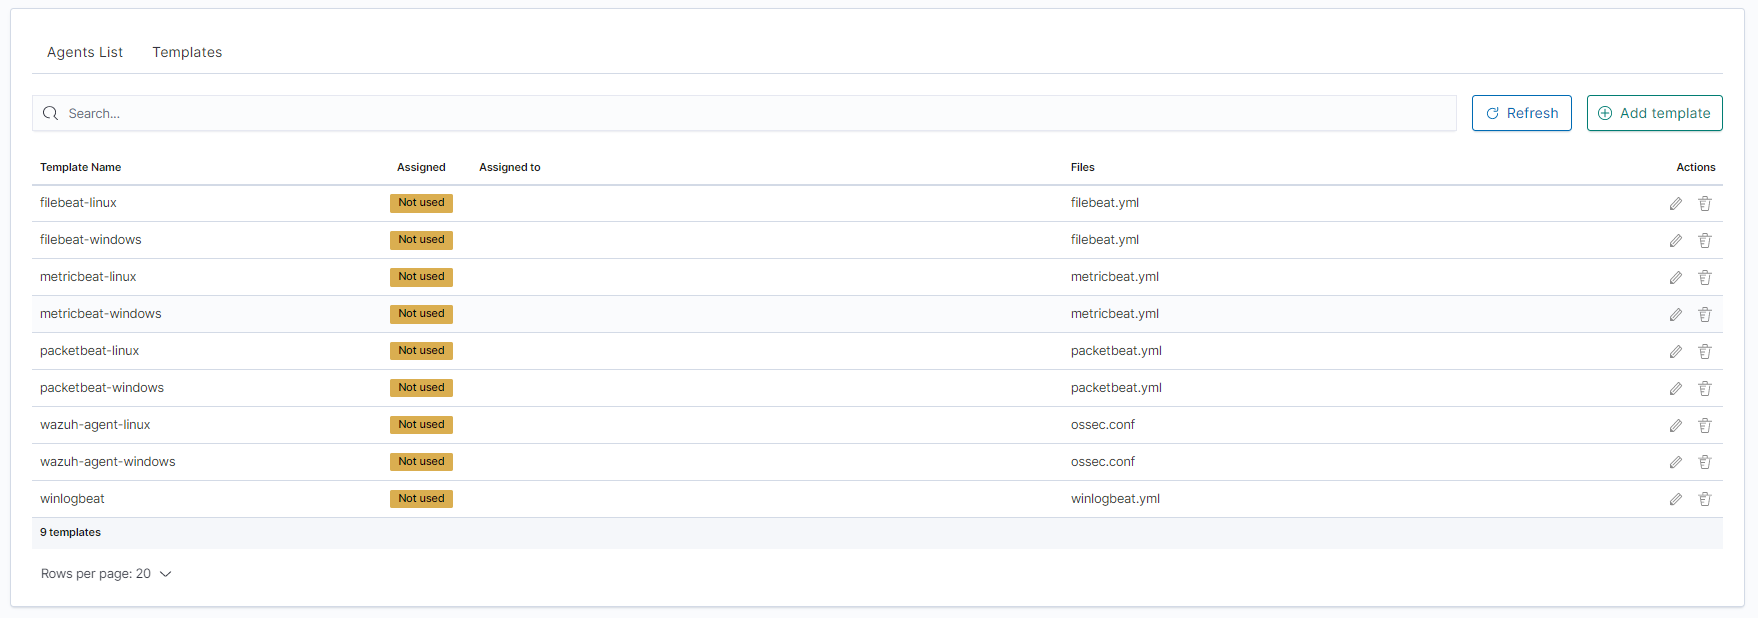
Click the
Create newfile button at the bottom.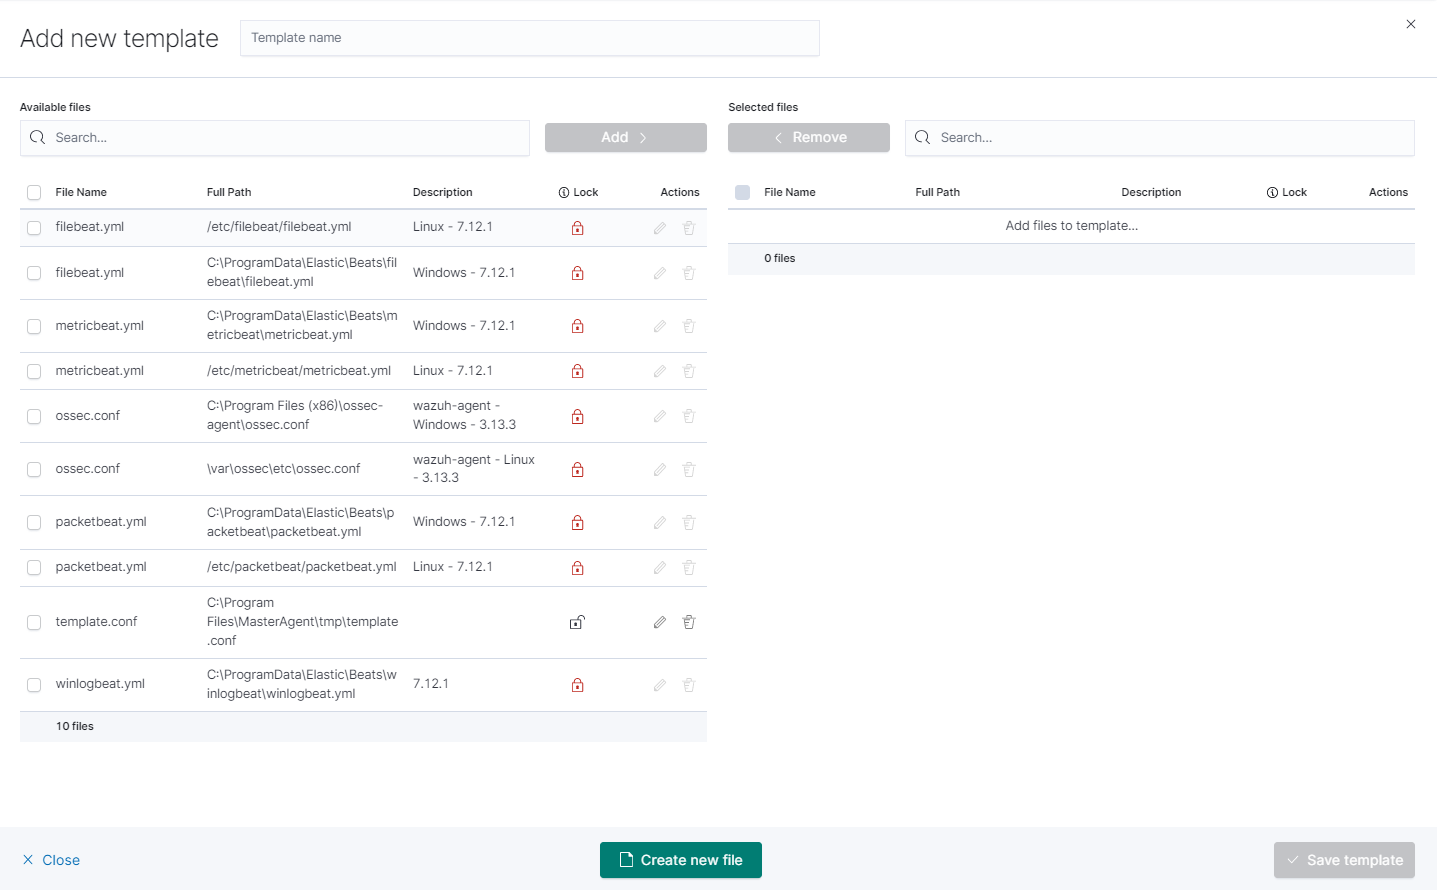
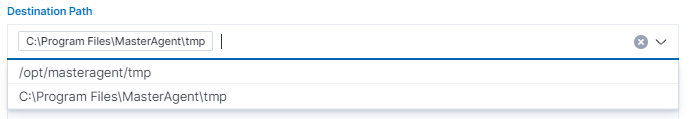
you will see the form to create a file that will be on a client system. There are inputs such as:
- Destination Path,
- File name,
- Description,
- Upload file,
- Content.
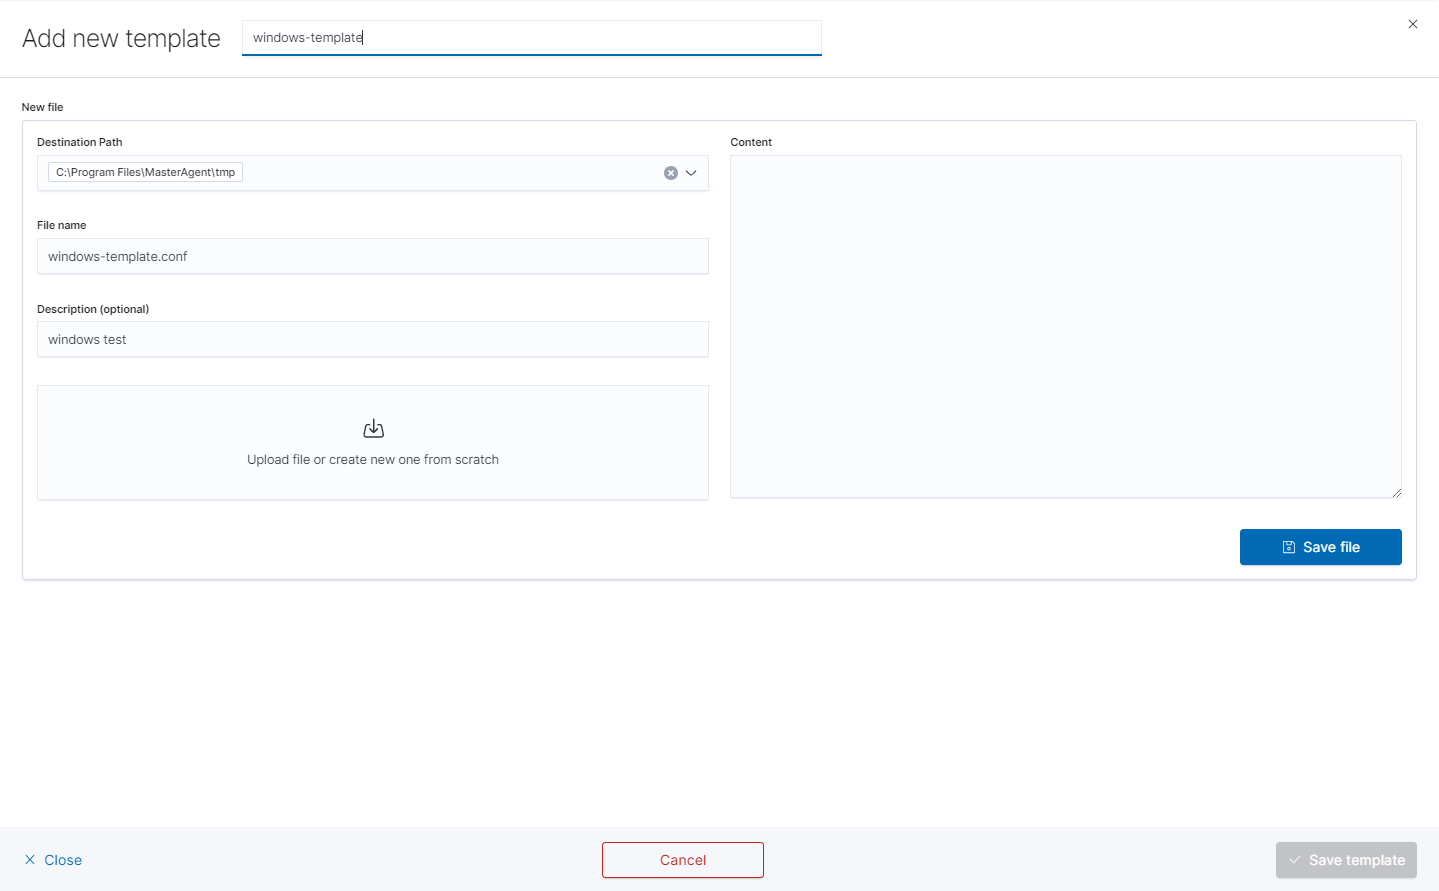
Remember that you must provide the exact path to your directory in the Destination Path field
After that add your file to the template by checking it from the
Available fileslist and clickingAddand thenCreate new file.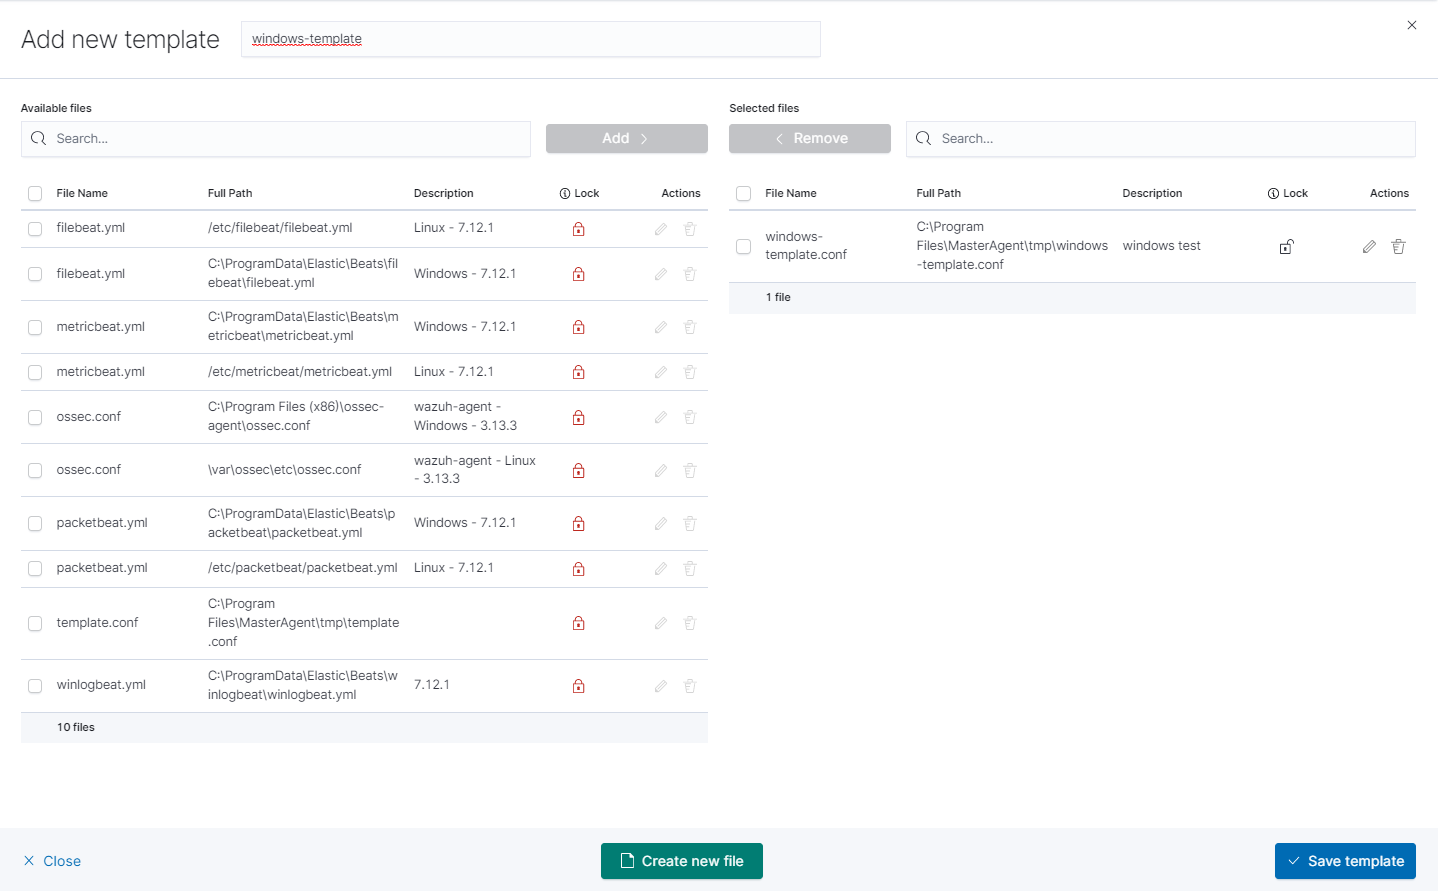
You can now see your template in the
Templatetab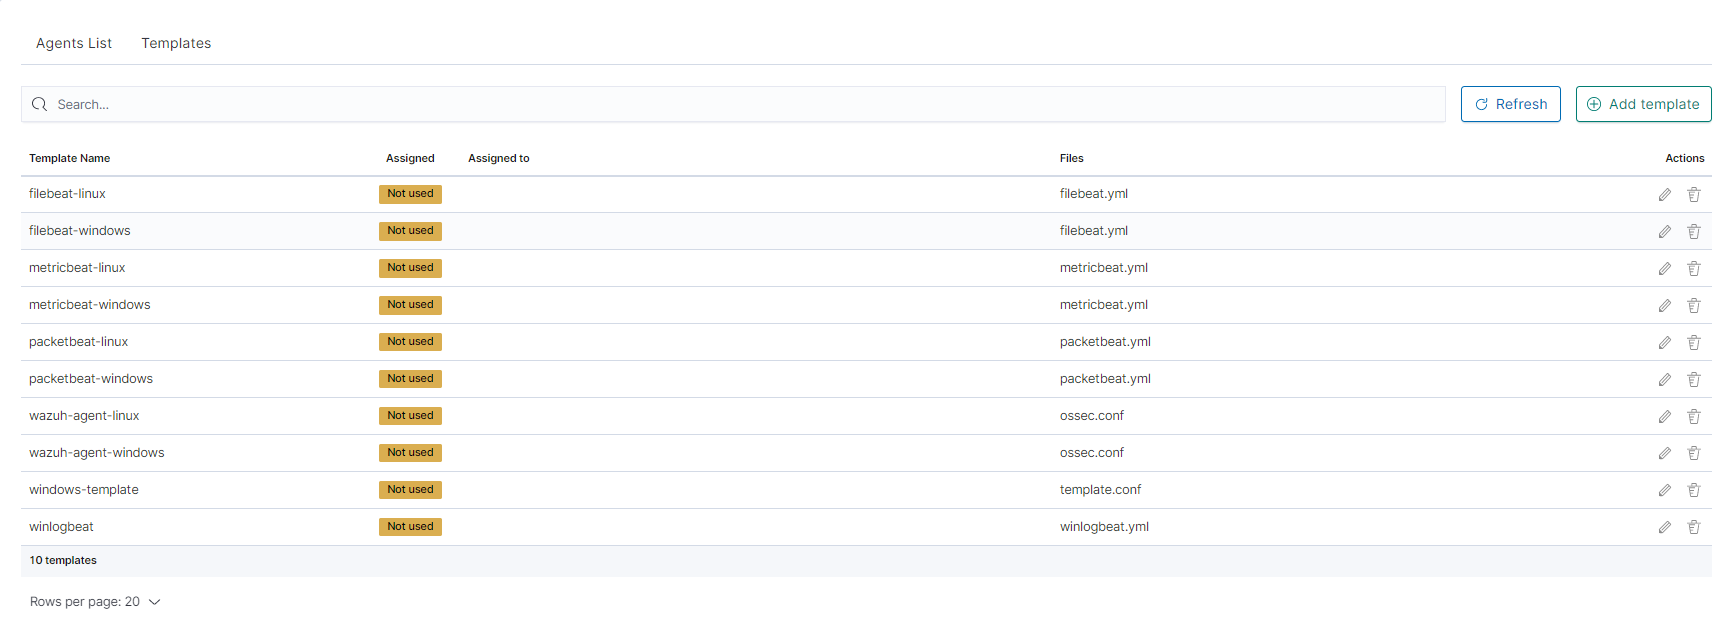
The next step will be to add the template to the agent by checking the agent’s form list and clicking
Apply Template.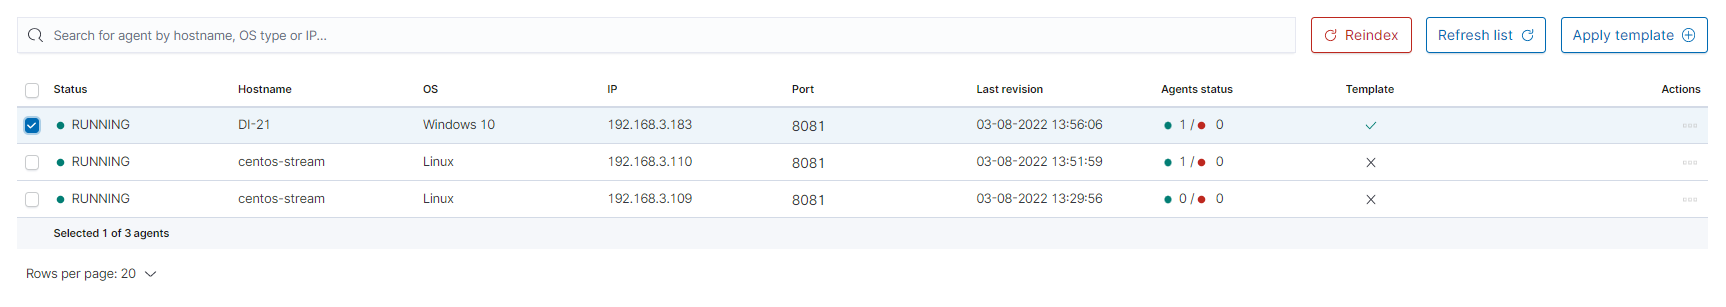
The last step is to apply the template by checking it from the list and clicking the
Applybutton.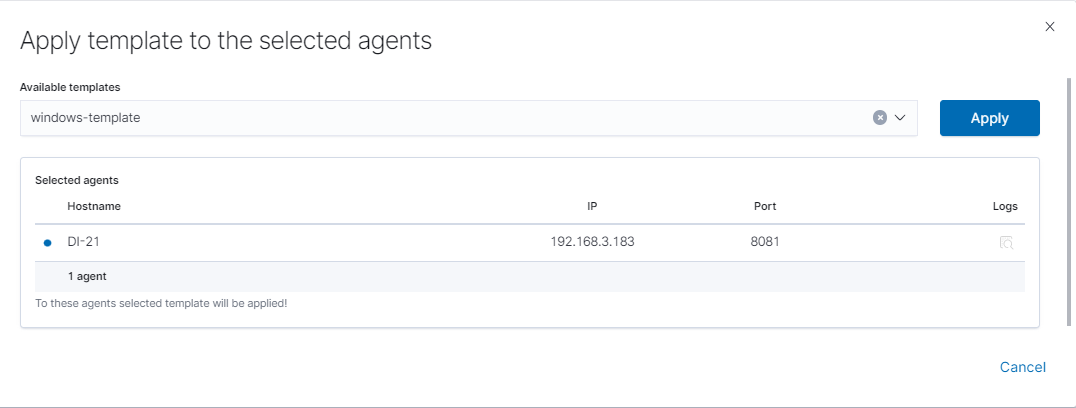
You can also select multiple agents. Remember, if your file path is Windows type You can only select Windows agents. You can check the Logs by clicking the icon in the
logscolumn.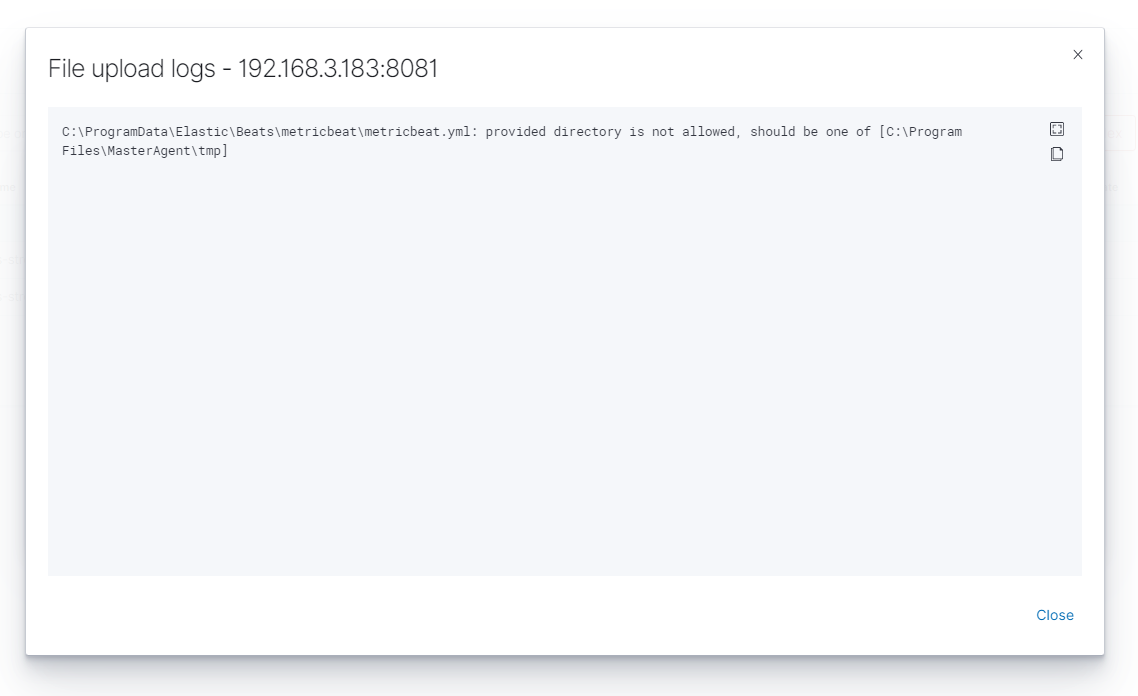
Agent module compatibility
The Agents module among others is compatible with Beats agents in the following versions:
| No | Agent Name | Beats Version |
|---|---|---|
1 |
Filebeat |
OSS 7.17.8 |
2 |
Packetbeat |
OSS 7.17.8 |
3 |
Winlogbeat |
OSS 7.17.8 |
4 |
Metricbeat |
OSS 7.17.8 |
5 |
Heartbeat |
OSS 7.17.8 |
6 |
Auditbeat |
OSS 7.17.8 |
7 |
Windows - Beats agents installation
Winlogbeat
Installation
- Copy the Winlogbeat installer from the installation directory
install/Agents/beats/windows/winlogbeat-oss-7.17.8-windows-x86_64.zipand unpack - Copy the installation files to the
C:\Program Files\Winlogbeatdirectory
Configuration
Editing the file: C:\Program Files\Winlogbeat\winlogbeat.yml:
In section:
winlogbeat.event_logs:
  - name: Application
    ignore_older: 72h
  - name: Security
  - name: System
change to:
winlogbeat.event_logs:
  - name: Application
    ignore_older: 72h
  - name: Security
    ignore_older: 72h
  - name: System
    ignore_older: 72h
In section:
setup.template.settings:
  index.number_of_shards: 1
change to:
#setup.template.settings:
  #index.number_of_shards: 1
In section:
setup.kibana:
change to:
#setup.kibana:
In section:
output.elasticsearch:
  # Array of hosts to connect to.
  hosts: ["localhost:9200"]
change to:
#output.elasticsearch:
  # Array of hosts to connect to.
  #hosts: ["localhost:9200"]
In section:
#output.logstash:
  # The Logstash hosts
  #hosts: ["localhost:5044"]
change to:
output.logstash:
  # The Logstash hosts
  hosts: ["logserver-probe-ip:5044"]
In section:
#tags: ["service-X", "web-tier"]
change to:
tags: ["winlogbeat"]
Run the
PowerShellconsole as Administrator and execute the following commands:cd 'C:\Program Files\Winlogbeat' .\install-service-winlogbeat.ps1 Security warning Run only scripts that you trust. While scripts from the internet can be useful, this script can potentially harm your computer. If you trust this script, use the Unblock-File cmdlet to allow the script to run without this warning message. Do you want to run C:\Program Files\Winlogbeat\install-service-winlogbeat.ps1? [D] Do not run [R] Run once [S] Suspend [?] Help (default is "D"): R
Output:
Status   Name               DisplayName
------   ----               -----------
Stopped    Winlogbeat      Winlogbeat
Start Winlogbeat service:
sc start Winlogbeat
Test configuration:
cd 'C:\Program Files\Winlogbeat'
winlogbeat.exe test config
winlogbeat.exe test output
Drop event
We can also drop events on the agent side. To do this we need to use the drop_event processor
processors:
  - drop_event:
      when:
        condition
Each condition receives a field to compare. You can specify multiple fields under the same condition by using AND between the fields (for example, field1 AND field2).
For each field, you can specify a simple field name or a nested map, for example, dns.question.name.
See Exported Fields for a list of all the fields that are exported by Winlogbeat.
The supported conditions are:
- equals
- contains
- regexp
- range
- network
- has_fields
- or
- and
- not
equals
With the equals condition, you can compare if a field has a certain value. The condition accepts only an integer or a string value.
For example, the following condition checks if the response code of the HTTP transaction is 200:
equals:
  http.response.code: 200
contains
The contains condition checks if a value is part of a field. The field can be a string or an array of strings. The condition accepts only a string value.
For example, the following condition checks if an error is part of the transaction status:
contains:
  status: "Specific error"
regexp
The regexp condition checks the field against a regular expression. The condition accepts only strings.
For example, the following condition checks if the process name starts with foo:
regexp:
  system.process.name: "^foo.*"
range
The range condition checks if the field is in a certain range of values. The condition supports lt, lte, gt, and gte. The condition accepts only integer or float values.
For example, the following condition checks for failed HTTP transactions by comparing the http.response.code field with 400.
range:
  http.response.code:
    gte: 400
This can also be written as:
range:
  http.response.code.gte: 400
The following condition checks if the CPU usage in percentage has a value between 0.5 and 0.8.
range:
  system.cpu.user.pct.gte: 0.5
  system.cpu.user.pct.lt: 0.8
network
The network condition checks if the field is in a certain IP network range. Both IPv4 and IPv6 addresses are supported. The network range may be specified using CIDR notation, like “192.0.2.0/24” or “2001:db8::/32”, or by using one of these named ranges:
loopback- Matches loopback addresses in the range of 127.0.0.0/8 or ::1/128.unicast- Matches global unicast addresses defined in RFC 1122, RFC 4632, and RFC 4291 with the exception of the IPv4 broadcast address (255.255.255.255). This includes private address ranges.multicast- Matches multicast addresses.interface_local_multicast- Matches IPv6 interface-local multicast addresses.link_local_unicast- Matches link-local unicast addresses.link_local_multicast- Matches link-local multicast addresses.private- Matches private address ranges defined in RFC 1918 (IPv4) and RFC 4193 (IPv6).public- Matches addresses that are not loopback, unspecified, IPv4 broadcast, link-local unicast, link-local multicast, interface local multicast, or private.unspecified- Matches unspecified addresses (either the IPv4 address “0.0.0.0” or the IPv6 address “::”).
The following condition returns true if the source.ip value is within the private address space.
network:
  source.ip: private
This condition returns true if the destination.ip value is within the IPv4 range of 192.168.1.0 - 192.168.1.255.
network:
  destination.ip: '192.168.1.0/24'
This condition returns true when destination.ip is within any of the given subnets.
network:
  destination.ip: ['192.168.1.0/24', '10.0.0.0/8', loopback]
has_fields
The has_fields condition checks if all the given fields exist in the event. The condition accepts a list of string values denoting the field names.
For example, the following condition checks if the http.response.code field is present in the event.
has_fields: ['http.response.code']
or
The or operator receives a list of conditions.
or:
  - <condition1>
  - <condition2>
  - <condition3>
  ...
For example, to configure the condition http.response.code = 304 OR http.response.code = 404:
or:
  - equals:
      http.response.code: 304
  - equals:
      http.response.code: 404
and
The and operator receives a list of conditions.
and:
  - <condition1>
  - <condition2>
  - <condition3>
  ...
For example, to configure the condition http.response.code = 200 AND status = OK:
or:
  - <condition1>
  - and:
    - <condition2>
    - <condition3>
not
The not operator receives the condition to negate.
not:
  <condition>
For example, to configure the condition NOT status = OK:
not:
  equals:
    status: OK
Internal queue
Winlogbeat uses an internal queue to store events before publishing them. The queue is responsible for buffering and combining events into batches that can be consumed by the outputs. The outputs will use bulk operations to send a batch of events in one transaction.
You can configure the type and behavior of the internal queue by setting options in the queue section of the winlogbeat.yml config file. Only one queue type can be configured.
This sample configuration sets the memory queue to buffer up to 4096 events:
queue.mem:
  events: 4096
Configure the memory queue The memory queue keeps all events in memory.
If no flush interval and no number of events to flush is configured, all events published to this queue will be directly consumed by the outputs. To enforce spooling in the queue, set the flush.min_events and flush.timeout options.
By default flush.min_events is set to 2048 and flush.timeout is set to 1s.
The output’s bulk_max_size setting limits the number of events being processed at once.
The memory queue waits for the output to acknowledge or drop events. If the queue is full, no new events can be inserted into the memory queue. Only after the signal from the output will the queue free up space for more events to be accepted.
This sample configuration forwards events to the output if 512 events are available or the oldest available event has been waiting for 5s in the queue:
queue.mem:
  events: 4096
  flush.min_events: 512
  flush.timeout: 5s
Configuration options
You can specify the following options in the queue.mem section of the winlogbeat.yml config file:
events
Number of events the queue can store.
The default value is 4096 events.
flush.min_events
Minimum number of events required for publishing. If this value is set to 0, the output can start publishing events without additional waiting times. Otherwise, the output has to wait for more events to become available.
The default value is 2048.
flush.timeout
Maximum wait time for flush.min_events to be fulfilled. If set to 0s, events will be immediately available for consumption.
The default value is 1s.
Configure disk queue The disk queue stores pending events on the disk rather than the main memory. This allows Beats to queue a larger number of events than is possible with the memory queue, and to save events when a Beat or device is restarted. This increased reliability comes with a performance tradeoff, as every incoming event must be written and read from the device’s disk. However, for setups where the disk is not the main bottleneck, the disk queue gives a simple and relatively low-overhead way to add a layer of robustness to incoming event data.
The disk queue is expected to replace the file spool in a future release.
To enable the disk queue with default settings, specify a maximum size:
queue.disk:
  max_size: 10GB
The queue will be used up to the specified maximum size on the disk. It will only use as much space as required. For example, if the queue is only storing 1GB of events, then it will only occupy 1GB on disk no matter how high the maximum is. Queue data is deleted from the disk after it has been successfully sent to the output.
Configuration options
You can specify the following options in the queue.disk section of the winlogbeat.yml config file:
path
The path to the directory where the disk queue should store its data files. The directory is created on startup if it doesn’t exist.
The default value is "${path.data}/diskqueue".
max_size (required)
The maximum size the queue should use on disk. Events that exceed this maximum will either pause their input or be discarded, depending on the input’s configuration.
A value of 0 means that no maximum size is enforced, and the queue can grow up to the amount of free space on the disk. This value should be used with caution, as filling a system’s main disk can make it inoperable. It is best to use this setting only with a dedicated data or backup partition that will not interfere with Winlogbeat or the rest of the host system.
The default value is 10GB.
segment_size
Data added to the queue is stored in segment files. Each segment contains some number of events waiting to be sent to the outputs and is deleted when all its events are sent. By default, segment size is limited to 1/10 of the maximum queue size. Using a smaller size means that the queue will use more data files, but they will be deleted more quickly after use. Using a larger size means some data will take longer to delete, but the queue will use fewer auxiliary files. It is usually fine to leave this value unchanged.
The default value is max_size / 10.
read_ahead
The number of events that should be read from disk into memory while waiting for an output to request them. If you find outputs are slowing down because they can’t read as many events at a time, adjusting this setting upward may help, at the cost of higher memory usage.
The default value is 512.
write_ahead
The number of events the queue should accept and store in memory while waiting for them to be written to disk. If you find the queue’s memory use is too high because events are waiting too long to be written to disk, adjusting this setting downward may help, at the cost of reduced event throughput. On the other hand, if inputs are waiting or discarding events because they are being produced faster than the disk can handle, adjusting this setting upward may help, at the cost of higher memory usage.
The default value is 2048.
retry_interval
Some disk errors may block the operation of the queue, for example, a permission error writing to the data directory, or a disk full error while writing an event. In this case, the queue reports the error and retries after pausing for the time specified in retry_interval.
The default value is 1s (one second).
max_retry_interval When multiple consecutive errors are written to the disk, the queue increases the retry interval by factors of 2 up to a maximum of max_retry_interval. Increase this value if you are concerned about logging too many errors or overloading the host system if the target disk becomes unavailable for an extended time.
The default value is 30s (thirty seconds).
Filebeat
Installation
- Copy the Filebeat installer from the installation directory
install/Agents/beats/windows/filebeat-oss-7.17.8-windows-x86_64.zipand unpack - Copy the installation files to the
C:\Program Files\Filebeatdirectory
Configuration
Editing the file: C:\Program Files\Filebeat\filebeat.yml:
In section:
- type: log

  # Change to true to enable this input configuration.
  enabled: false
change to:
- type: log

  # Change to true to enable this input configuration.
  enabled: true
In section:
    paths:
    - /var/log/*.log
    #- c:\programdata\elasticsearch\logs\*
change to:
paths:
    #- /var/log/*.log
    #- c:\programdata\elasticsearch\logs\*
    - "C:\Program Files\Microsoft SQL Server\*\MSSQL\Log\*"
    - "C:\inetpub\logs\*""
In section:
setup.template.settings:
  index.number_of_shards: 1
change to:
#setup.template.settings:
  #index.number_of_shards: 1
In section:
setup.kibana:
change to:
#setup.kibana:
In section:
output.elasticsearch:
  # Array of hosts to connect to.
  hosts: ["localhost:9200"]
change to:
#output.elasticsearch:
  # Array of hosts to connect to.
  #hosts: ["localhost:9200"]
In section:
#output.logstash:
  # The Logstash hosts
  #hosts: ["localhost:5044"]
change to:
output.logstash:
  # The Logstash hosts
  hosts: ["logserver-probe-ip:5044"]
In section:
#tags: ["service-X", "web-tier"]
change to:
tags: ["filebeat"]
Run the
PowerShellconsole as Administrator and execute the following commands:cd 'C:\Program Files\Filebeat' .\install-service-filebeat.ps1 Security warning Run only scripts that you trust. While scripts from the internet can be useful, this script can potentially harm your computer. If you trust this script, use the Unblock-File cmdlet to allow the script to run without this warning message. Do you want to run C:\Program Files\Filebeat\install-service-filebeat.ps1? [D] Do not run [R] Run once [S] Suspend [?] Help (default is "D"): R
Output:
Status   Name               DisplayName
------   ----               -----------
Stopped  Filebeat        Filebeat
Start Filebeat service:
sc start filebeat
You can enable, disable, and list Filebeat modules using the following command:
cd 'C:\Program Files\Filebeat'
filebeat.exe modules list
filebeat.exe modules apache enable
filebeat.exe modules apache disable
Test configuration:
cd 'C:\Program Files\Filebeat'
filebeat.exe test config
filebeat.exe test output
Metricbeat
Installation
- Copy the Metricbeat installer from the installation directory
install/Agents/beats/windows/merticbeat-oss-7.17.8-windows-x86_64.zipand unpack - Copy the installation files to the
C:\Program Files\Merticbeatdirectory
Configuration
Editing the file: C:\Program Files\Merticbeat\metricbeat.yml:
In section:
setup.template.settings:
  index.number_of_shards: 1
  index.codec: best_compression
change to:
#setup.template.settings:
  #index.number_of_shards: 1
  #index.codec: best_compression
In section:
setup.kibana:
change to:
#setup.kibana:
In section:
output.elasticsearch:
  # Array of hosts to connect to.
  hosts: ["localhost:9200"]
change to:
#output.elasticsearch:
  # Array of hosts to connect to.
  #hosts: ["localhost:9200"]
In section:
#output.logstash:
  # The Logstash hosts
  #hosts: ["localhost:5044"]
change to:
output.logstash:
  # The Logstash hosts
  hosts: ["logserver-probe-ip:5044"]
In section:
#tags: ["service-X", "web-tier"]
change to:
tags: ["metricbeat"]
Run the
PowerShellconsole as Administrator and execute the following commands:cd 'C:\Program Files\Metricbeat' .\install-service-metricbeat.ps1 Security warning Run only scripts that you trust. While scripts from the internet can be useful, this script can potentially harm your computer. If you trust this script, use the Unblock-File cmdlet to allow the script to run without this warning message. Do you want to run C:\Program Files\Metricbeat\install-service-metricbeat.ps1? [D] Do not run [R] Run once [S] Suspend [?] Help (default is "D"): R
Output:
Status   Name               DisplayName
------   ----               -----------
Stopped  Metricbeat        Metricbeat
Start Filebeat service:
sc start metricbeat
You can enable, disable, and list Metricbeat modules using the following command:
cd 'C:\Program Files\Metricbeat'
metricbeat.exe modules list
metricbeat.exe modules apache enable
metricbeat.exe modules apache disable
Test configuration:
cd 'C:\Program Files\Metricbeat'
metricbeat.exe test config
metricbeat.exe test output
Packetbeat
Installation
- Copy the Packetbeat installer from the installation directory
install/Agents/beats/windows/packetbeat-oss-7.17.8-windows-x86_64.zipand unpack - Copy the installation files to the
C:\Program Files\Packetbeatdirectory
Configuration
Editing the file: C:\Program Files\Packetbeat\packetbeat.yml:
In section:
setup.template.settings:
  index.number_of_shards: 3
change to:
#setup.template.settings:
  #index.number_of_shards: 3
In section:
setup.kibana:
change to:
#setup.kibana:
In section:
output.elasticsearch:
  # Array of hosts to connect to.
  hosts: ["localhost:9200"]
change to:
#output.elasticsearch:
  # Array of hosts to connect to.
  #hosts: ["localhost:9200"]
In section:
#output.logstash:
  # The Logstash hosts
  #hosts: ["localhost:5044"]
change to:
output.logstash:
  # The Logstash hosts
  hosts: ["logserver-probe-ip:5044"]
In section:
#tags: ["service-X", "web-tier"]
change to:
tags: ["packetbeat"]
Run the
PowerShellconsole as Administrator and execute the following commands:cd 'C:\Program Files\Packetbeat' .\install-service-packetbeat.ps1 Security warning Run only scripts that you trust. While scripts from the internet can be useful, this script can potentially harm your computer. If you trust this script, use the Unblock-File cmdlet to allow the script to run without this warning message. Do you want to run C:\Program Files\Packetbeat\install-service-packetbeat.ps1? [D] Do not run [R] Run once [S] Suspend [?] Help (default is "D"): R
Output:
Status   Name               DisplayName
------   ----               -----------
Stopped  Packetbeat        Packetbeat
Start Packetbeat service:
sc start packetbeat
Test configuration:
cd 'C:\Program Files\Packetbeat'
packetbeat.exe test config
packetbeat.exe test output
Linux - Beats agents installation
Filebeat
Installation
Copy the Filebeat installer from the installation directory
install/Agents/beats/linux/filebeat-oss-7.17.8-x86_64.rpmInstall filebeat with the following command:
yum install -y filebeat-oss-7.17.8-x86_64.rpm
Configuration
Editing the file: /etc/filebeat/filebeat.yml:
In section:
- type: log

  # Change to true to enable this input configuration.
  enabled: false
change to:
- type: log

  # Change to true to enable this input configuration.
  enabled: true
In section:
setup.template.settings:
  index.number_of_shards: 1
change to:
#setup.template.settings:
  #index.number_of_shards: 1
In section:
setup.kibana:
change to:
#setup.kibana:
In section:
output.elasticsearch:
  # Array of hosts to connect to.
  hosts: ["localhost:9200"]
change to:
#output.elasticsearch:
  # Array of hosts to connect to.
  #hosts: ["localhost:9200"]
In section:
#output.logstash:
  # The Logstash hosts
  #hosts: ["localhost:5044"]
change to:
output.logstash:
  # The Logstash hosts
  hosts: ["logserver-probe-ip:5044"]
In section:
#tags: ["service-X", "web-tier"]
change to:
tags: ["filebeat"]
Start Filebeat service:
systemctl start filebeat
You can enable, disable, and list Filebeat modules using the following command:
filebeat modules list
filebeat modules apache enable
filebeat modules apache disable
Test configuration:
filebeat test config
filebeat test output
Metricbeat
Installation
Copy the Metricbeat installer from the installation directory
install/Agents/beats/linux/metricbeat-oss-7.17.8-x86_64.rpmInstall Metricbeat with the following command:
yum install -y metricbeat-oss-7.17.8-x86_64.rpm
Configuration
Editing the file: /etc/metricbeat/metricbeat.yml:
In section:
setup.template.settings:
  index.number_of_shards: 1
  index.codec: best_compression
change to:
#setup.template.settings:
  #index.number_of_shards: 1
  #index.codec: best_compression
In section:
setup.kibana:
change to:
#setup.kibana:
In section:
output.elasticsearch:
  # Array of hosts to connect to.
  hosts: ["localhost:9200"]
change to:
#output.elasticsearch:
  # Array of hosts to connect to.
  #hosts: ["localhost:9200"]
In section:
#output.logstash:
  # The Logstash hosts
  #hosts: ["localhost:5044"]
change to:
output.logstash:
  # The Logstash hosts
  hosts: ["logserver-probe-ip:5044"]
In section:
#tags: ["service-X", "web-tier"]
change to:
tags: ["metricbeat"]
Start Filebeat service:
systemctl start metricbeat
You can enable, disable, and list Metricbeat modules using the following command:
metricbeat modules list
metricbeat modules apache enable
metricbeat modules apache disable
Test configuration:
metricbeat test config
metricbeat test output
Packetbeat
Installation
Copy the Packetbeat installer from the installation directory
install/Agents/beats/linux/packetbeat-oss-7.17.8-x86_64.rpmInstall Packetbeat with the following command:
yum install -y packetbeat-oss-7.17.8-x86_64.rpm
Configuration
Editing the file: /etc/packetbeat/packetbeat.yml:
In section:
setup.template.settings:
  index.number_of_shards: 3
change to:
#setup.template.settings:
  #index.number_of_shards: 3
In section:
setup.kibana:
change to:
#setup.kibana:
In section:
output.elasticsearch:
  # Array of hosts to connect to.
  hosts: ["localhost:9200"]
change to:
#output.elasticsearch:
  # Array of hosts to connect to.
  #hosts: ["localhost:9200"]
In section:
#output.logstash:
  # The Logstash hosts
  #hosts: ["localhost:5044"]
change to:
output.logstash:
  # The Logstash hosts
  hosts: ["logserver-probe-ip:5044"]
In section:
#tags: ["service-X", "web-tier"]
change to:
tags: ["packetbeat"]
Start Packetbeat service:
servicectl start packetbeat
Test configuration:
packetbeat test config
packetbeat test output
Kafka
Kafka allows you to distribute the load between nodes receiving data and encrypts communication.
Architecture example:
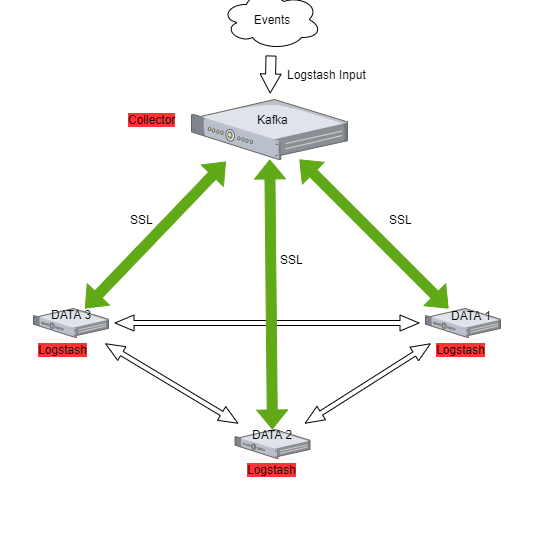
The Kafka installation
To install the Kafka, follow the steps below:
Java installation
yum install java-11-openjdk-headless.x86_64
Create users for Kafka
useradd kafka -m -d /opt/kafka -s /sbin/nologin
Download the installation package::
https://www.apache.org/dyn/closer.cgi?path=/kafka/3.2.0/kafka_2.13-3.2.0.tgzUnpack installation files to the
/opt/kafkadirectory:tar -xzvf kafka_2.13-3.2.0.tgz -C /opt/ mv /opt/kafka_2.13-3.2.0 /opt/kafka
Set the necessary permissions
chown -R kafka:kafka /opt/kafka
Edit configs and set the data and log directory:
vim /opt/kafka/config/server.propertieslog.dirs=/tmp/kafka-logsSet the necessary firewall rules:
firewall-cmd --permanent --add-port=2181/tcp
firewall-cmd --permanent --add-port=2888/tcp
firewall-cmd --permanent --add-port=3888/tcp
firewall-cmd --permanent --add-port=9092/tcp
firewall-cmd --reload
Create service files:
vim /usr/lib/systemd/system/zookeeper.service[Unit] Requires=network.target remote-fs.target After=network.target remote-fs.target [Service] Type=simple User=kafka ExecStart=/opt/kafka/bin/zookeeper-server-start.sh /opt/kafka/config/zookeeper.properties ExecStop=/opt/kafka/bin/zookeeper-server-stop.sh Restart=on-abnormal [Install] WantedBy=multi-user.target
vim create /usr/lib/systemd/system/kafka.service[Unit] Requires=zookeeper.service After=zookeeper.service [Service] Type=simple User=kafka ExecStart=/bin/sh -c '/opt/kafka/bin/kafka-server-start.sh /opt/kafka/config/server.properties > /opt/kafka/kafka.log 2>&1' ExecStop=/opt/kafka/bin/kafka-server-stop.sh Restart=on-abnormal [Install] WantedBy=multi-user.target
Reload
systemctldaemon and the Kafka services:systemctl daemon-reload systemctl enable zookeeper kafka systemctl start zookeeper kafka
To test add the Kafka topic:
/opt/kafka/bin/kafka-topics.sh --bootstrap-server localhost:9092 --create --partitions 1 --replication-factor 1 --topic test
List existing topics:
/opt/kafka/bin/kafka-topics.sh --bootstrap-server localhost:9092 --list
Generate test messages
/opt/kafka/bin/kafka-console-producer.sh --topic test --bootstrap-server localhost:9092
   message 1
   message 2
   ...
Read test messages
/opt/kafka/bin/kafka-console-consumer.sh --topic test --from-beginning --bootstrap-server localhost:9092
Kafka encryption
Generate server keystore with certificate pair.
Complete:
- Certificate validity period;
- The name of the alias;
- The FQDN of the server;
- Server IP;
keytool -keystore server.keystore.jks -alias {alias_name} -validity {validity} -genkey -keyalg RSA -ext SAN=DNS:{FQDN},IP:{server_IP}
Creating your own CA
openssl req -new -x509 -keyout rootCA.key -out rootCA.crt -days 365
Import CA to server keystore and client keystore:
keytool -keystore server.truststore.jks -alias CARoot -import -file rootCA.crt
keytool -keystore client.truststore.jks -alias CARoot -import -file rootCA.crt
Create a certificate signing request:
Complete:
- The name of the alias;
- The FQDN of the server;
- Server IP;
keytool -keystore server.keystore.jks -alias {alias_name} -certreq -file cert-file -ext SAN=DNS:{FQDN},IP:{server_IP}
Sign in certificate
Complete:
- The name of the alias;
- The FQDN of the server;
- Server IP;
- Password
openssl x509 -req -extfile <(printf"subjectAltName = DNS:{FQDN},IP:{server_IP}") -CA rootCA.crt -CAkey rootCA.key -in cert-file -out cert-signed -days 3650 -CAcreateserial -passin pass:{password}
Import rootCA and cert-signed to server keystore
keytool -keystore server.keystore.jks -alias CARoot -import -file rootCA.crt
keytool -keystore server.keystore.jks -alias els710 -import -file cert-signed
If you have trusted certificates, you must import them into the JKS keystore as follows:
Create a keystore:
Complete:
- Certificate validity period;
- The name of the alias;
- The FQDN of the server;
- Server IP;
keytool -keystore client.keystore.jks -alias {alias_name} -validity {validity} -keyalg RSA -genkey
Combine the certificate and key file into a certificate in p12 format:
Complete:
- your cert name;
- your key name;
- friendly name;
- CA cert file;
openssl pkcs12 -export -in {your_cert_name} -inkey {your_key_name} -out {your_pair_name}.p12 -name {friendly_name} -CAfile ca.crt -caname root
Import the CA certificate into a truststore:
Complete:
- CA cert file;
keytool -keystore client.truststore.jks -alias CARoot -import -file {CAfile}
Import the CA certificate into a keystore:
Complete:
- CA cert file.
keytool -keystore client.keystore.jks -alias CARoot -import -file {CAfile}
Import the p12 certificate into a keystore:
Complete:
- Your p12 pair;
- Keystore password;
keytool -importkeystore -deststorepass {keystore_password} -destkeystore client.keystore.jks -srckeystore {your_pair_name}.p12 -srcstoretype PKCS12
Configuring Kafka Brokers
In
/opt/kafka/server.propertiesfile set the following options:Complete:
- Path to server keystore;
- Keystore password;
- Password for certificate key;
- Path to server truststore;
- Truststore password.
listeners=PLAINTEXT://localhost:9092,SSL://{FQDN}:9093
ssl.keystore.location={path_to_server_keystore}/server.keystore.jks
ssl.keystore.password={keysotre_passowrd}
ssl.key.password={key_password}
ssl.truststore.location={path_to_server_truststore}/server.truststore.jks
ssl.truststore.password={truststore_passowrd}
ssl.enabled.protocols=TLSv1.2
ssl.client.auth=required
security.inter.broker.protocol=SSL
Restart the Kafka service
systemctl restart kafka
Configuring Kafka Clients
Configure the output section in Network Probe based on the following example:
Complete:
- Server FQDN;
- Path to client truststore;
- Truststore password.
output {
  kafka {
    bootstrap_servers => "{FQDN}:9093"
    security_protocol => "SSL"
    ssl_truststore_type => "JKS"
    ssl_truststore_location => "{path_to_client_truststore}/client.truststore.jks"
    ssl_truststore_password => "{password_to_client_truststore}"
    client_id => "host.name"
    topic_id => "Topic-1"
    codec => json
  }
}
Configure the input section in Network Probe based on the following example:
Complete:
- Server FQDN;
- Path to client truststore;
- Truststore password.
input {
  kafka {
    bootstrap_servers => "{}:port"
    security_protocol => "SSL"
    ssl_truststore_type => "JKS"
    ssl_truststore_location => "{path_to_client_truststore}/client.truststore.jks"
    ssl_truststore_password => "{password_to_client_truststore}"
    consumer_threads => 4
    topics => [ "Topic-1" ]
    codec => json
    tags => ["kafka"]
   }
}
Log retention for Kafka topic
The Kafka durably persists all published records—whether or not they have been consumed—using a configurable retention period. For example, if the retention policy is set to two days, then for the two days after a record is published, it is available for consumption, after which it will be discarded to free up space. Kafka’s performance is effectively constant concerning data size so storing data for a long time is not a problem.
Event Collector
The Event Collector allows you to get events from remote Windows computers and store them in the ITRS Log Analytics indexes. The destination log path for the events is a property of the subscription. The ITRS Log Analytics Event Collector allows to definition of an event subscription on an ITRS Log Analytics collector without defining the event source computers. Multiple remote event source computers can then be set up (using for example a group policy setting) to forward events to the ITRS Log Analytics. The Event Collector doesn’t require installation of any additional applications/agents on Windows source hosts.
Configuration steps
Installation of Event Collector
tar zxf wec_7x-master.tar.gz -C /opt/
mkdir /opt/wec
mv /opt/wec_7x-master/ /opt/wec/
mkdir /etc/wec
cp /opt/wec/sub_manager/config.yaml /etc/wec/config.yaml
Generate certificate
mkdir /opt/wec/certgen
cd /opt/wec/certgen
vim server-certopts.cnf
Set
DNS.1andIP.1for the WEC server:[req] default_bits = 4096 default_md = sha256 req_extensions = req_ext keyUsage = keyEncipherment,dataEncipherment basicConstraints = CA:FALSE distinguished_name = dn [ req_ext ] subjectAltName = @alt_names extendedKeyUsage = serverAuth,clientAuth [ alt_names ] DNS.1 = wec.local.domain IP.1 = 192.168.13.163 [dn]
Set
DNS.1andIP.1for client certificate:vim client-certopts.cnf[req] default_bits = 4096 default_md = sha256 req_extensions = req_ext keyUsage = keyEncipherment,dataEncipherment basicConstraints = CA:FALSE distinguished_name = dn [ req_ext ] subjectAltName = @alt_names extendedKeyUsage = serverAuth,clientAuth [ alt_names ] DNS.1 = *local.domain [dn]
Generate the CA certificate and private key, next check fingerprint:
openssl genrsa -out ca.key 4096
openssl req -x509 -new -nodes -key ca.key -days 3650 -out ca.crt -subj '/CN=wec.local.domain/O=example.com/C=CA/ST=QC/L=Montreal'
openssl x509 -in ca.crt -fingerprint -sha1 -noout | sed -e 's/\://g' > ca.fingerprint
Generate the client certificate and export it together with the CA in PFX format to be imported into the Windows certificate store:
openssl req -new -newkey rsa:4096 -nodes -out server.csr -keyout server.key -subj '/CN=wec.local.domain/O=example.com/C=CA/ST=QC/L=Montreal'
openssl x509 -req -in server.csr -out server.crt -CA ca.crt -CAkey ca.key -CAcreateserial -extfile server-certopts.cnf -extensions req_ext -days 365
Generate the server certificate to be used by the WEC:
openssl req -new -newkey rsa:4096 -nodes -out client.csr -keyout client.key -subj '/CN=wec.local.domain/O=example.com/C=CA/ST=QC/L=Montreal'
openssl x509 -req -in client.csr -out client.crt -CA ca.crt -CAkey ca.key -CAcreateserial -extfile client-certopts.cnf -extensions req_ext -days 365
openssl pkcs12 -export  -inkey client.key -in client.crt -certfile ca.crt -out client.p12
Event Collector Configuration
Copy the server certificate and server key to the Event Collector installation directory:
cp server.crt server.key /opt/wec/sub_manager/certificates/
Edit configuration file
config.yamlvim /etc/wec/config.yaml- set the following options:
external_host: wec.local.domain
#check ca.fingerprint file
ca_fingerprint: 97DDCD6F3AFA511EED5D3312BC50D194A9C9FA9A
certificate: /opt/wec/sub_manager/certificates/server.crt
key: /opt/wec/sub_manager/certificates/server.key
- set the output for Event Collector to Network Probe forwarding:
remote_syslog:
    # forward events to remote syslog server
    address: 192.168.13.170
    port: 5614
- set the output to saving events to a local file:
outputfile: /var/log/wec/events-{:%Y-%d-%m}.log
- disable local syslog output:
local_syslog: false
- set the filter section:
filters:
          # source list

  - source: 'Security'
          filter: '*[System[(Level=1 or Level=2 or Level=3 or Level=4 or Level=0 or Level=5) and (EventID=4672 or EventID=4624 or EventID=4634)]]'

     - source: 'Application'
          filter: '*[System[(Level=1 or Level=2 or Level=3 or Level=4 or Level=0 or Level=5)]]'

        - source: 'System'
          filter: '*[System[(Level=1 or Level=2 or Level=3 or Level=4 or Level=0 or Level=5)]]'
Install dependencies
Python 3.8 installation:
sudo yum -y update
sudo yum -y groupinstall "Development Tools"
sudo yum -y install openssl-devel bzip2-devel libffi-devel
sudo yum -y install wget
wget https://www.python.org/ftp/python/3.8.3/Python-3.8.3.tgz
tar xvf Python-3.8.3.tgz
cd Python-3.8*/
./configure --enable-optimizations
sudo make altinstall
python3.8 --version
Python requirements installation:
pip3.8 install PyYAML
pip3.8 install sslkeylog
Running Event Collector service
vim /etc/systemd/system/wec.service
[Unit]
Description=WEC Service
After=network.target

[Service]
Type=simple
ExecStart=/usr/local/bin/python3.8 /opt/wec/sub_manager/run.py -c /etc/wec/config.yaml
Restart=on-failure
RestartSec=42s
StandardOutput=syslog
StandardError=syslog
SyslogIdentifier=wecservice

[Install]
WantedBy=multi-user.target
systemctl daemon-reload
systemctl start wc
Windows host configuration
Open the
Microsoft Management Console (mmc.exe), selectFile -> Add/Remove Snap-ins, and add theCertificatessnap-in.Select
Computer Account.Right-click the
Personalnode, and selectAll Tasks > Import.Find and select the client certificate (client.p12) and import this file.
The
PKCS #12archive contains the CA certificate as well.Move the CA certificate to the
Trusted Root Certification Authoritiesnode after the import.Give
NetworkServiceaccess to the private key file of the client authentication certificate:To forward security logs:
- In
CompMgmt.msc, underLocal Users and Groups, clickGroups > Event Log Readersto openEvent Log Readers Properties. - Add the “NETWORK SERVICE” account to the
Event Log Readers group.
8.1. For domain controller use “Group Policy Manager Editor” and edit: “Default Domain Controller Policy”:
- From
Computer Configuration>Policy, expandWindows Settings>Security Settings>Restricted Groups; - From the contest menu add:
Add Group - Add the following configuration:
- Group =
BUILTIN\Event Log Readers- Members =
NT Authority\NETWORK SERVICE
- Members =
- Group =
- In
Make sure the collector server is reachable from the Windows machine
Run
winrm qcand accept changes on the Windows machineRun
winrm set winrm/config/client/auth @{Certificate="true"}on windows machine to enable certificate authenticationOpen
gpedit.mscUnder the
Computer Configuration node, expand theAdministrative Templatesnode, then expand theWindows Componentsnode, and then select theEvent Forwardingnode.Select the SubscriptionManagers setting and enable it. Click the Show button to add a subscription (use the CA thumbprint you saved earlier):
Server=https://<FQDN of the collector>:5986/wsman/SubscriptionManager/WEC,Refresh=<Refresh interval in seconds>,IssuerCA=<Thumbprint of the root CA>
For example:
Server=HTTPS://logserver.diplux.com:5986/wsman/SubscriptionManager/WEC,Refresh=60,IssuerCA=549A72B56560A5CAA392078D9C38B52458616D2
5
NOTE: If you wish to set up multiple subscriptions because you want to forward Windows events to multiple event collectors (such as WEC), then you can do that here.
Run the
cmdconsole with administrative privileges and make the following commandgpupdate /force
Network Probe pipeline configuration
Create a directory for Event Collector pipeline configuration files:
mkdir /etc/logserver-probe/conf.d/syslog_wec
Copy the following Network Probe configuration files to the pipeline directory:
cp 001-input-wec.conf /etc/logserver-probe/conf.d/syslog_wec/
cp 050-filter-wec.conf /etc/logserver-probe/conf.d/syslog_wec/
cp 060-filter-wec-siem.conf /etc/logserver-probe/conf.d/syslog_wec/
cp 100-output-wec.conf /etc/logserver-probe/conf.d/syslog_wec/
Enabling Network Probe pipeline
To enable the syslog_wec Network Probe pipeline edit the pipelie.yml file:
vim /etc/logserver-probe/pipeline.yml
Add the following section:
- pipeline.id: syslog_wec
  path.config: "/etc/logserver-probe/conf.d/syslog_wec/*.conf"
And restart Network Probe with systemct restart command
Data Node template
Install the Data Node template for the Event Collector data index:
curl -ulogserver:logserver -X PUT "http://localhost:9200/_template/syslog_wec?pretty" -H 'Content-Type: application/json' -d@template_wec.json
Building the subscription filter
Browse to Event Viewer
Right-click Subscriptions and create subscription
Click on Select Events and choose the type of logs that you want, for example, Event Level, Event Logs, Include Exclude Event ID, Keyword, etc.
Switch to XML view tab;
Copy the value of the
Select Pathkey, for example:<QueryList> <Query Id="0" Path="Security"> <Select Path="Security">*[System[(Level=1 or Level=2 or Level=3) and (EventID=4672 or EventID=4624 or EventID=4634)]]</Select> </Query> </QueryList>
string to copy:
*[System[(Level=1 or Level=2 or Level=3) and (EventID=4672 or EventID=4624 or EventID=4634)]]
Paste the above definition into the Event Collector configuration file in the
filterssection:vim /etc/wec/config.yamlfilters: - source: 'Security' filter: '*[System[(Level=1 or Level=2 or Level=3) and (EventID=4672 or EventID=4624 or EventID=4634)]]'
Restart the Event Collector service
systemctl restart wec
Cerebro Configuration
Configuration file: /opt/cerebro/conf/application.conf
Authentication
auth = {
  type: basic
    settings: {
      username = "logserver"
      password = "logserver"
    }
}
A list of known Data Node hosts
hosts = [
  {
    host = "https://localhost:9200"
    name = "itrs-log-analytics"
    auth = {
      username = "logserver"
      password = "logserver"
    }
  }
]

play.ws.ssl {
  trustManager = {
    stores = [
      { type = "PEM", path = "/etc/logserver/ssl/rootCA.crt" }
    ]
  }
}
play.ws.ssl.loose.acceptAnyCertificate=true
SSL access to Cerebro
   http = {
     port = "disabled"
   }
   https = {
     port = "5602"
   }

   # SSL access to cerebro - no self signed certificates
   #play.server.https {
   #  keyStore = {
   #    path = "keystore.jks",
   #    password = "SuperSecretKeystorePassword"
   #  }
   #}

   #play.ws.ssl {
   #  trustManager = {
   #    stores = [
   #      { type = "JKS", path = "truststore.jks", password =       SuperSecretTruststorePassword"  }
   #    ]
   #  }
   #}
service restart
systemctl start cerebro
register backup/snapshot repository for Data Node
   curl -k -XPUT "https://127.0.0.1:9200/_snapshot/backup?pretty" -H 'Content-Type: plication/      json' -d'
   {
     "type": "fs",
     "settings": {
       "location": "/var/lib/logserver/backup/"
     }
   }' -u logserver:logserver
login using curl
   curl -k -XPOST 'https://192.168.3.11:5602/auth/login' -H 'mimeType: application/      -www-form-urlencoded' -d 'user=logserver&password=logserver' -c cookie.txt
   curl -k -XGET 'https://192.168.3.11:5602' -b cookie.txt
Field level security
You can restrict access to specific fields in documents for a user role. For example: the user can only view specific fields in the Discovery module, other fields will be inaccessible to the user. You can do this by:
You can do this by adding the index to the
field includesorfield excludesin theCreate Roletab.- Includes are only fields that will be visible to the user.
- Excludes are fields that the user cannot see.
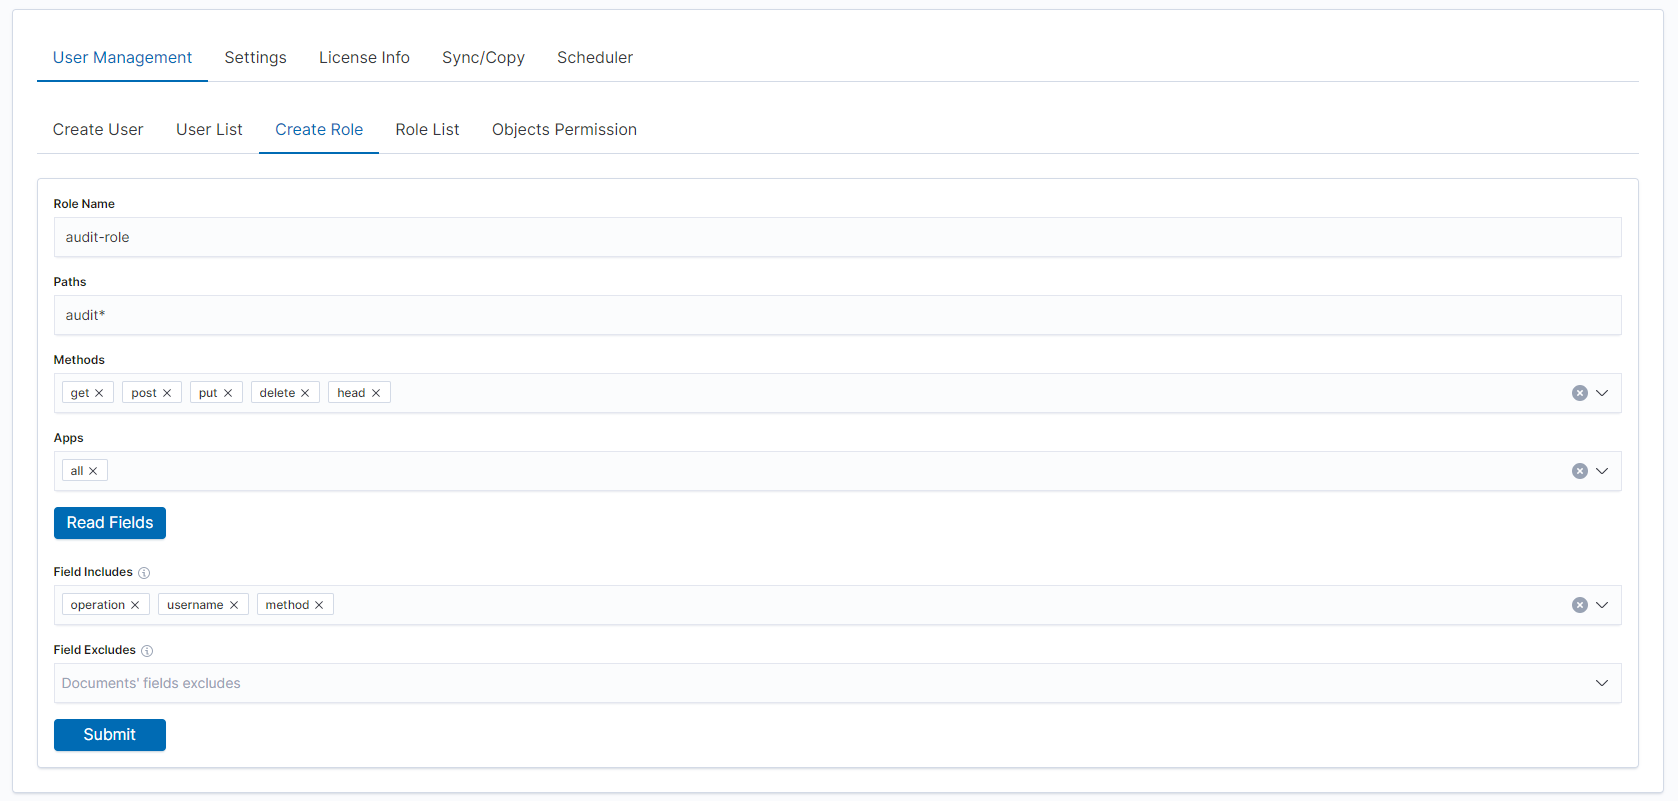
After that, you will see the new role in the
Role listtab.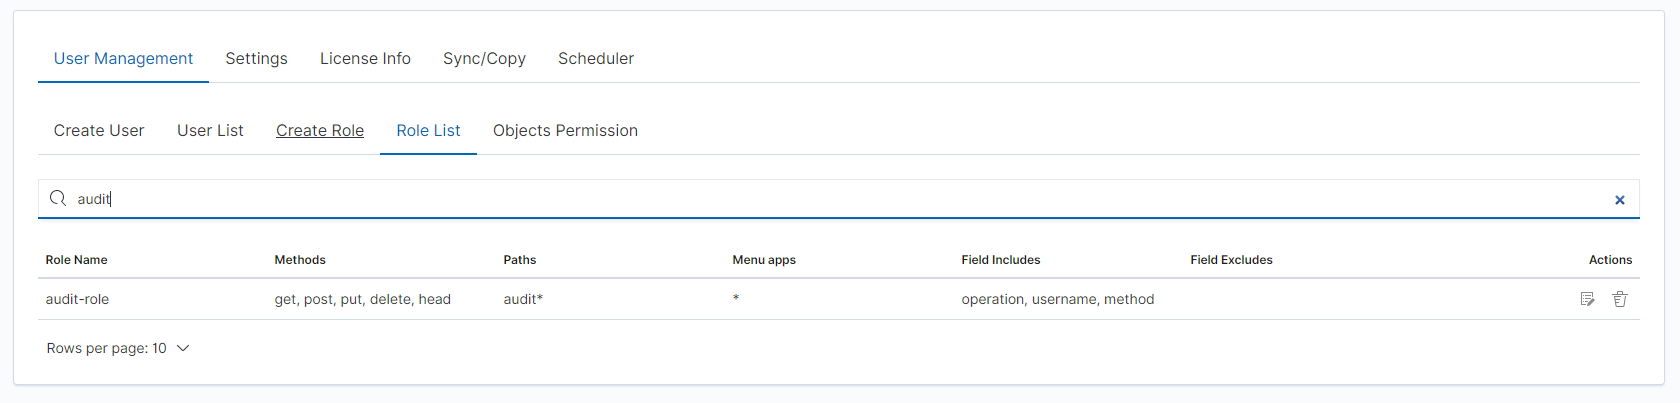
Add your user to the new
Role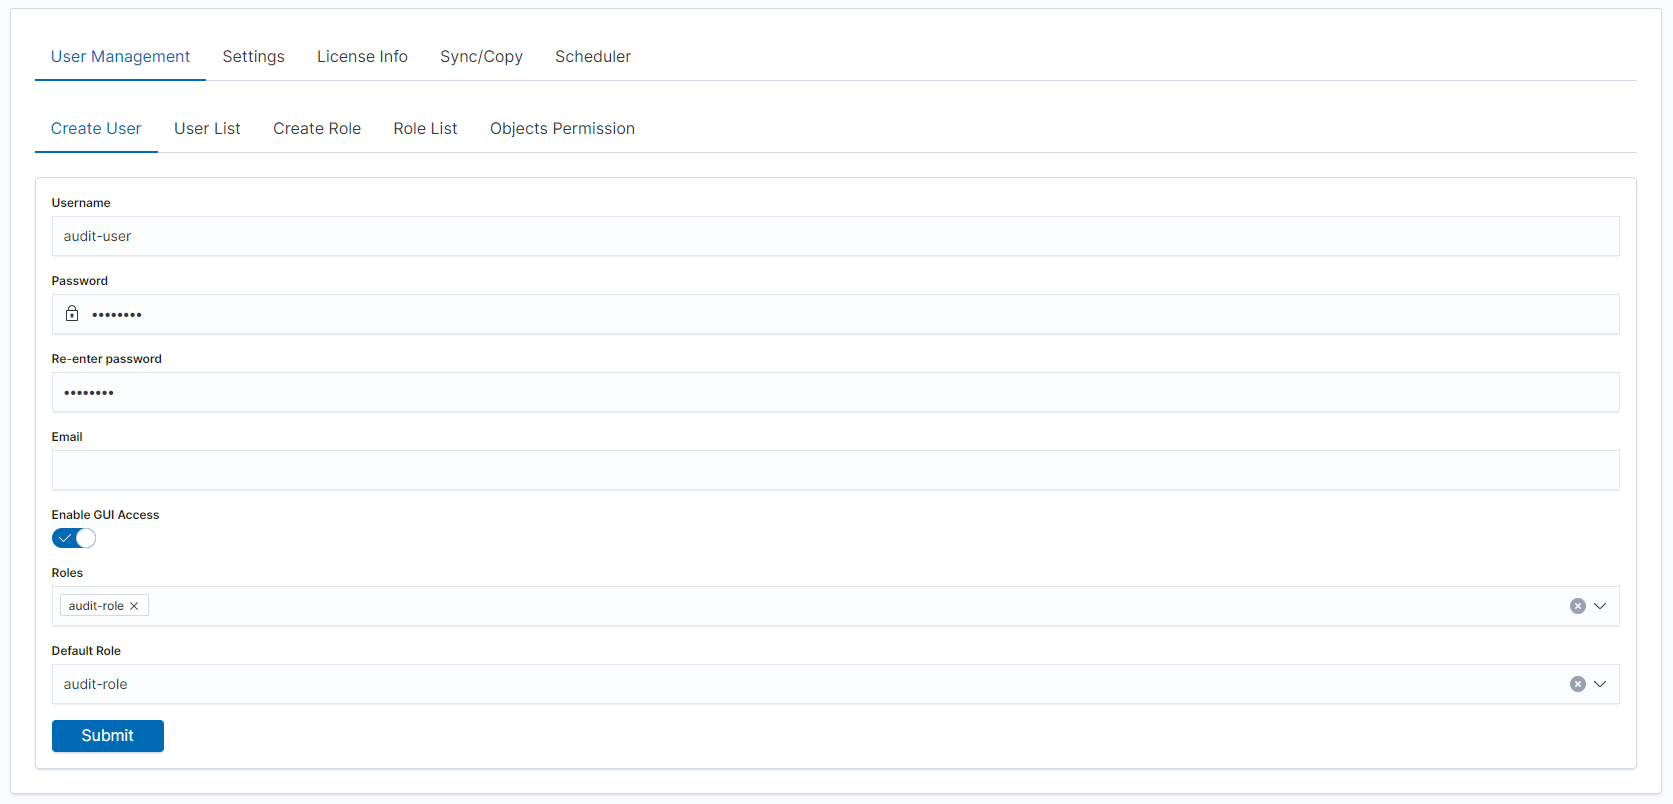
You can now log in as a user with a new role, the user in the Discovery module should only see selected fields.
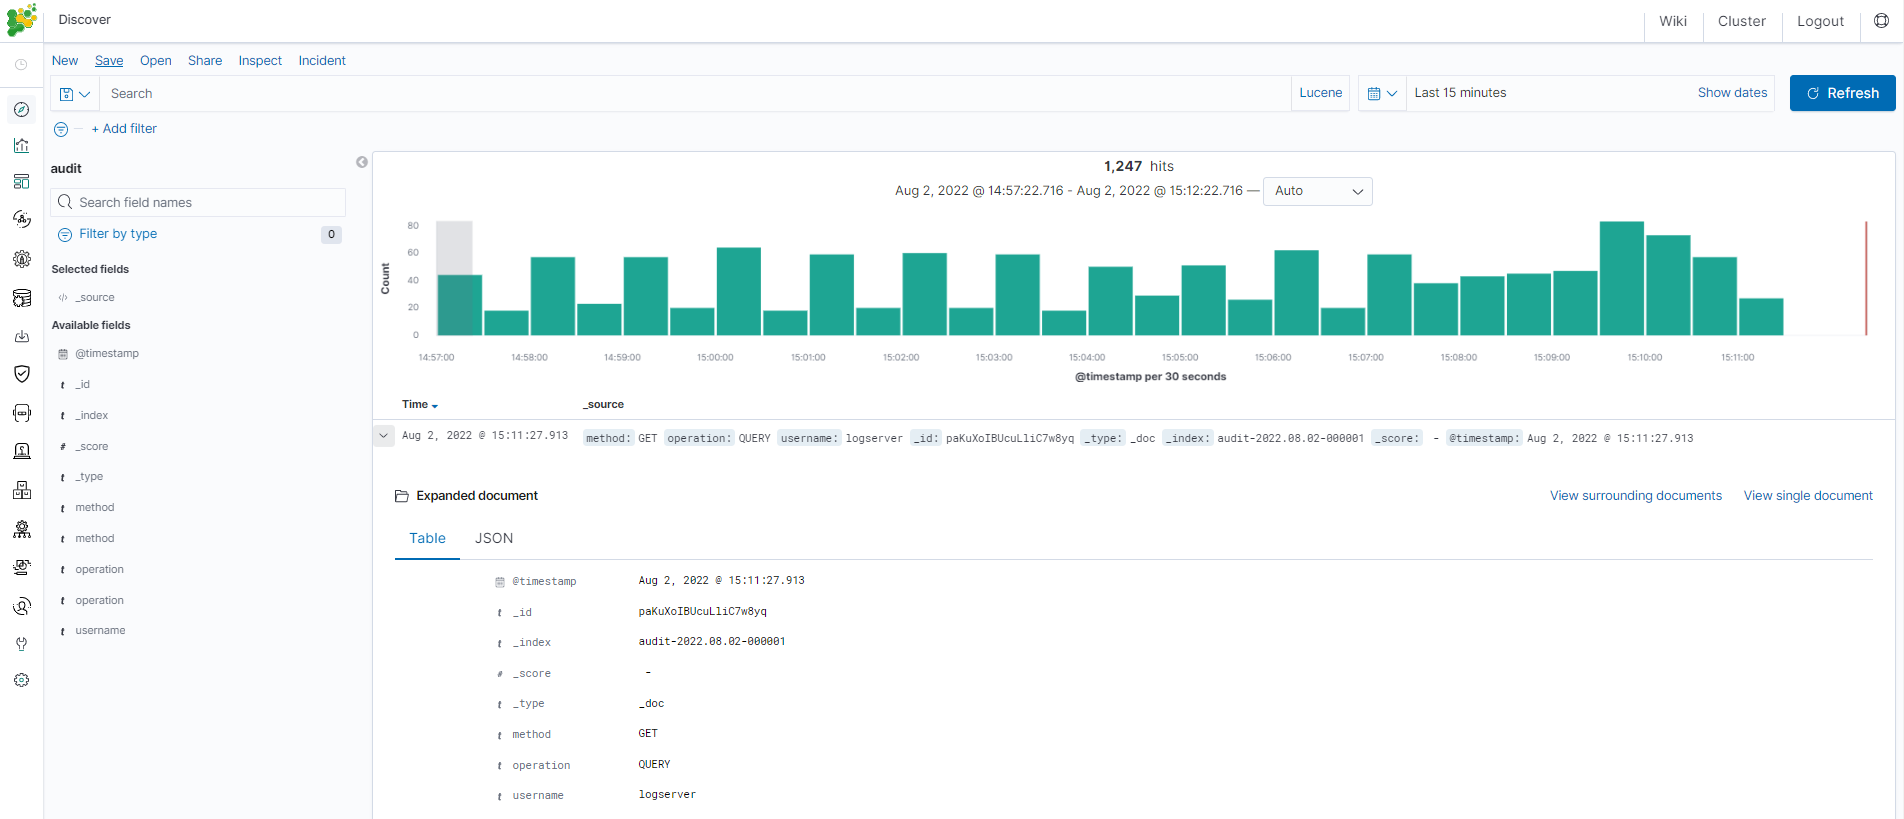
Default Language
Changing default language for GUI
The GUI language can be changed as follows:
Add
.i18nrc.jsonto/usr/share/logserver-gui/directory:{ "translations": ["translations/ja-JP.json"] }
Upload a translation to /usr/share/logserver-gui/translations/ directory
Set the permission:
# chown -R user:group /usr/share/logserver-gui/translations/Set in
logserver-gui.ymlfile:i18n.locale: "ja-JP"Restart Logserver GUI service
Finally, the result should be as shown in the picture:
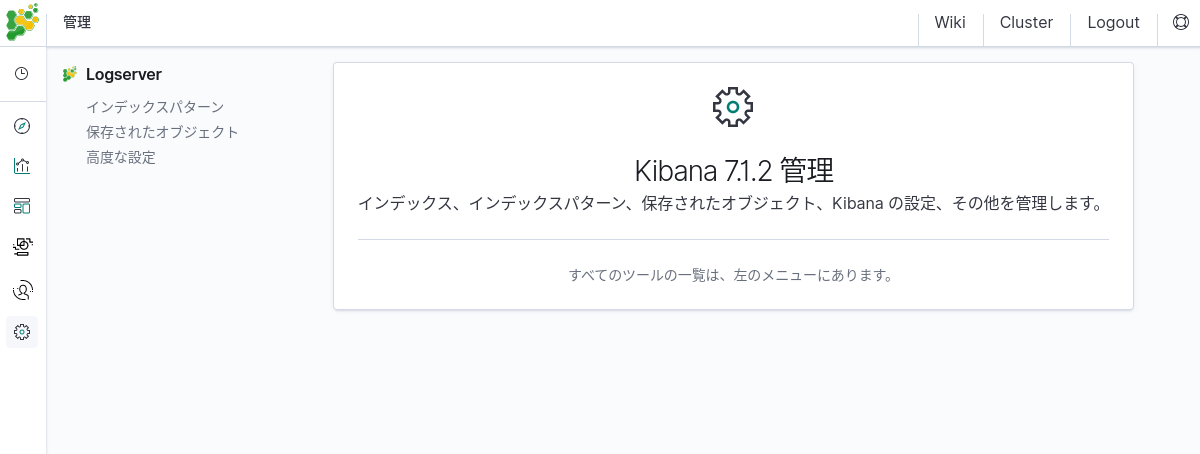
Preparing translation for GUI
Source file to use as a base for translations: /usr/share/logserver-gui/translations/en-EN.example.json
Bullet points for translations
For the translation to work you have to follow these steps. Omitting some may result in missing translation in some parts of an application or an empty screen when entering a broken portion of an app.
The file with translation is JSON.
Translated values have the following structure:
{
    "message": {
      "key.for.the.value": "Translated value for the key"
    }
}
Every key is meant to be unique. There can be only one value for each key. In the messages object, each key has a “text” value, not a number and not an object.
But there are some structures in a source file that you will use as a base of your translation that have to be addressed during the process to achieve that.
Objects
{
  "messages": {
    "common.ui.aggTypes.buckets.filtersTitle": {
      "text": "Filters",
      "comment": "The name of an aggregation, that allows to specify multiple individual filters to group data by."
    }
  }
}
This has to be transformed as described above - a key
common.ui.aggTypes.buckets.filtersTitlehas to have a text assigned to it. The value that needs to be translated is in the fields “text” and “comment” described to you how the value needs to be translated. The result of such will be:{ "messages":{ "common.ui.aggTypes.buckets.filtersTitle": "Filtry" } }
Template variables
{
  "messages": {
    "common.ui.aggTypes.buckets.dateHistogramLabel": "{filedName} per {intervalDescription}"
  }
}
Any text that is encapsulated in
{}has to be left as is. Those values are substituted by the application.How to treat complicated structures, eg.: plurals, etc.
{
 "messages": {
   "kbn.discover.hitsPluralTitle": "{hits, plural, one {hit} other {hits}}"
 }
}
As of now, there is a single example of the above. Contrary to the last point the value in
{}has to be translated for that key. So{hit}and{hits}.React compliant filenames
In the application codebase, some methods will take translated keys and substitute them. But many of those will work only if the name of the translation file is one of:
enen-USen-xaeses-LAfrfr-FRdede-DEjaja-JPkoko-KRzhzh-CNplruru-BYru-KGru-KZru-MDru-UA
FAQ
- Can I just paste everything into a basic(or advanced) translation software? ~No. There are some points to follow for the translation file to work at all.
- I have the following error - is the application broken:
- Error formatting message: A message must be provided as a String or AST ~It is possible you have not followed point 1 - you have left some object structures in your file.
- Blank page in GUI ~It is usually caused by not following point 2 -some variable names were changed.
- I have set “i18n.locale” in the configuration file but the app is not translated. ~You may have forgotten to put a reference for your file in
.i18nrc.jsonfile.
Known issues
- Some text may not be translated in Management -> Advanced settings even though keys for them are present in translation files.
- The same thing may happen in Discover -> View surrounding documents.
- Not an issue but plugin names (links on the left menu) do not translate.